
In late 2021, I was contacted by Robert Hajnal, an elite ultrarunner who was looking for advice about training and coaching ahead of the UTMB 2022. Robert was already an extremely competitive and talented runner, but he realized that a coach could help him improve his performance in the rapidly developing world of ultra-running. Our work together paid off. Robert finished in ninth place out of 1789 competitors on Mont Blanc.
This article explores five of the key TrainingPeaks metrics for runners we used to monitor and influence their training. Understanding where these are applicable to your own training and racing is a good starting point. Moreover, these metrics rely on accurately set benchmarking and thresholds, such as pace, in your athlete profile in TrainingPeaks.
Additionally, it is important to use these metrics not in isolation but as part of a holistic view of individual workouts and your specific needs.
1. Aerobic Decoupling (Pa:Hr)
Decoupling indicates how much endurance you have at low aerobic intensities, by showing how much your heart rate goes up over the course of a steady endurance run. We used this primarily on long run days as a way of tracking pacing and fueling.

For all long runs, we aimed to achieve a score of less than 5%. This metric, coupled with Robert’s subjective feedback of how he felt at the end of the run, helped provide insight into race day pacing and fueling, which we refined on each of his long training runs.
How to Use Aerobic Decoupling (Pa:Hr) in Your Training
If you are experiencing aerobic decoupling above 5%, two factors are likely at play:
- You’re under-fueled or not drinking enough to offset fluid loss.
- The pace you are aiming to achieve isn’t yet sustainable, causing your heart rate to rise to sustain the pace.
Environmental factors can also influence your Pa:Hr (such as heat stress), but if you’re running in relatively stable conditions and you see a larger Pa:Hr, then review your hydration/fueling plans and your pacing and see if this helps reduce cardiac drift.
2. Efficiency Factor (EF)
Efficiency Factor (EF) analyzes Normalized Graded Pace relative to the average heart rate for a given workout. By comparing like-for-like workouts (for example, a recovery run with another recovery run or a long run relative to other long runs), you can track how your efficiency (your pace relative to effort) is improving.

With respect to your training, it is important to appreciate the impact that altitude, heat, or other atmospheric and environmental factors may have on your heart rate and how this can affect your metrics. Robert completed a four-week altitude camp prior to running the 105-mile UTMB. At the start of it, his EF had dropped from where it was when he was training at sea level. However, over the four weeks, we were able to track it and see how his body was adapting to the elevation.
I use WKO5, a desktop-based, in-depth, custom analysis software that lets me create bespoke charts. One chart I use tracks the EF trend over time. When I see this beginning to plateau, it can be an indication that we need to introduce a new training stimulus.
How to Use Efficiency Factor (EF) in Your Training
Your Efficiency Factor trend should rise steadily as your fitness improves. When your EF begins to plateau, you’ll need to increase either the intensity or volume of your workouts. If your EF drops, that may be an indication of overtraining or illness.

3. Velocità Ascensionale Media (VAM)
Velocità Ascensionale Media, or VAM, is an Italian term that refers to a measure of average climbing speed (recorded in meters climbed per hour). This is highly valuable to trail and ultra-runners and was a key metric for us when measuring improvements in climbing speed.

With this metric, it is important to appreciate how it is influenced by the duration of a climb. A three-minute hill repetition at high intensity will have a higher VAM than a 20-minute longer effort at a lower duration.
I monitored VAM primarily for hill-specific sessions and compared them with hill repetitions of similar intensity and duration. When I saw VAM slowing in improvement, we progressed onto a new hill training stimulus.
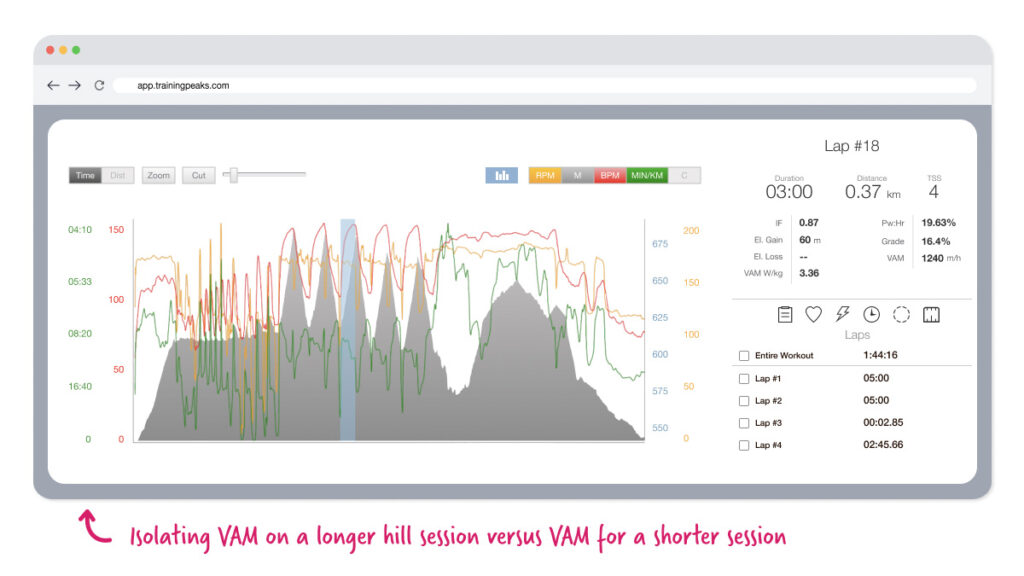
Secondly, I monitored VAM on long training runs by isolating specific climbs. By tracking climbing speed over time on these runs (which were also more specific to Robert’s goal race), I could see that the hill training sessions were translating across into his long run climbing speed.
How to Use VAM in Your Training
Your VAM — when comparing similar hill-specific workouts or long runs — should steadily increase as you near your race. If your VAM begins to slow in improvement, you’ll need to introduce some new hill training stimulus (i.e., a steeper or longer incline).
4. Rating of Perceived Exertion (RPE) vs. Intensity Factor (IF)
Intensity Factor (IF) tracks the relative intensity of a given workout. It is based on heart rate, pace, or power data. Meanwhile, the Rating of Perceived Exertion (RPE) is a subjective measure that athletes can add following a workout into TrainingPeaks. Using WKO5, I had a report that tracked RPE and IF and showed their respective trends.

This one report helps combine data collected from Robert’s watch and his subjective view and allows for comparison over time. When RPE relative to IF began to rise, this was one measure suggesting that it was potentially time for some recovery. Likewise, if RPE was dropping relative to IF, this meant that he was feeling good, and we could potentially increase training load or intensity.
How to Use RPE in Your Training
If you find that easier workouts feel hard, this is an indication that recovery might be required. The reverse is also true — if harder, higher-intensity workouts feel easier and your RPE is lower, this is an indication that you are ready to increase intensity or volume.
5. Performance Management Chart (PMC)
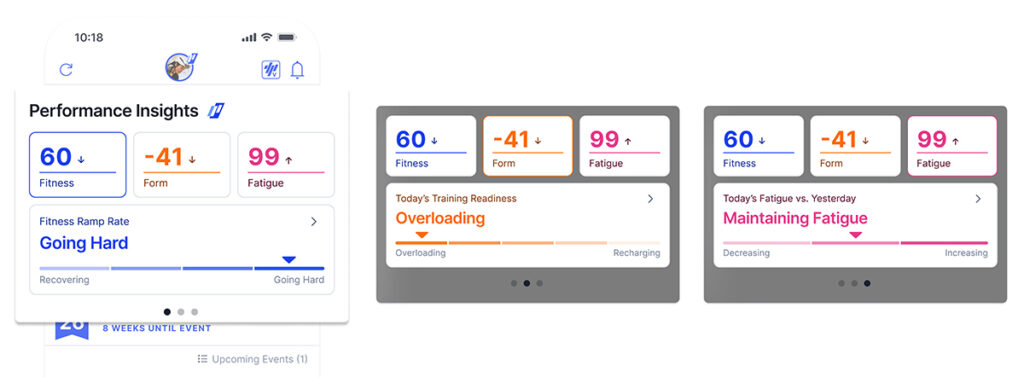
TrainingPeaks’ Performance Management Chart, or PMC, allows you to track Fitness (CTL), Fatigue (ATL), and Form (TSB) metrics over time. Through structured workouts, you can also predict future load and preparedness. The PMC is extremely valuable. While the other metrics above relate to individual workouts, this chart is based on a combined view of all previous workouts, allowing for an overview of training versus an individual workout analysis.
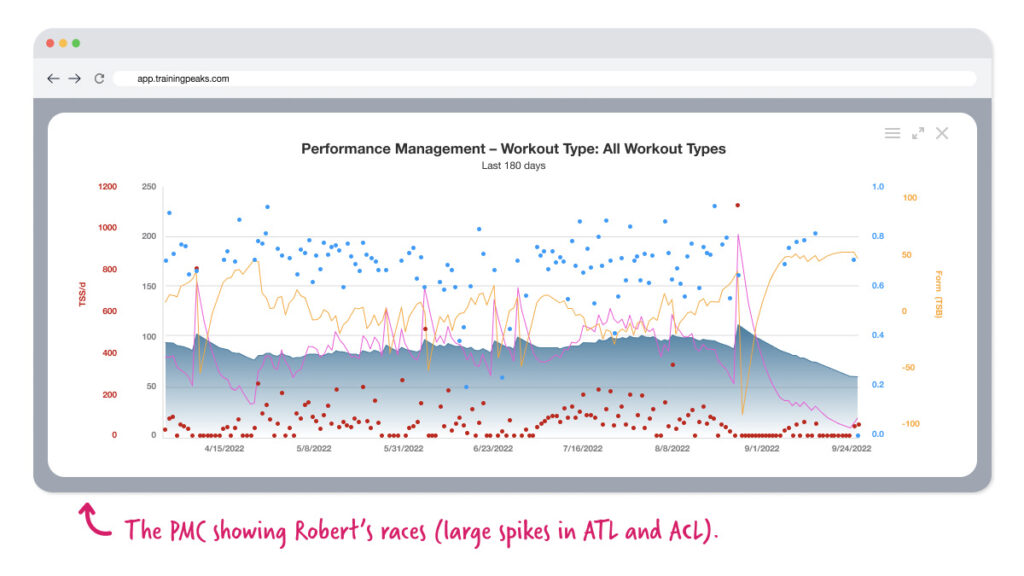
The PMC helped illustrate Robert’s progress and ensured his training stress was not ramping up too quickly. It also ensured that his Form did not drop too low. In general, we aimed to keep his Form above -30 unless he was doing a particularly challenging training block.
How to Use the Performance Management Chart in Your Training
The PMC provides an overview of your Fitness, Fatigue, and Form and can help guide your training and recovery. Charting each workout allows you to see how fresh you are, and using Structured Workouts can provide a forecast of future Fitness, Fatigue, and Form. You can find out more here.
In addition to these metrics, another key feature of TrainingPeaks that helped improve Robert’s training was Structured Workouts.
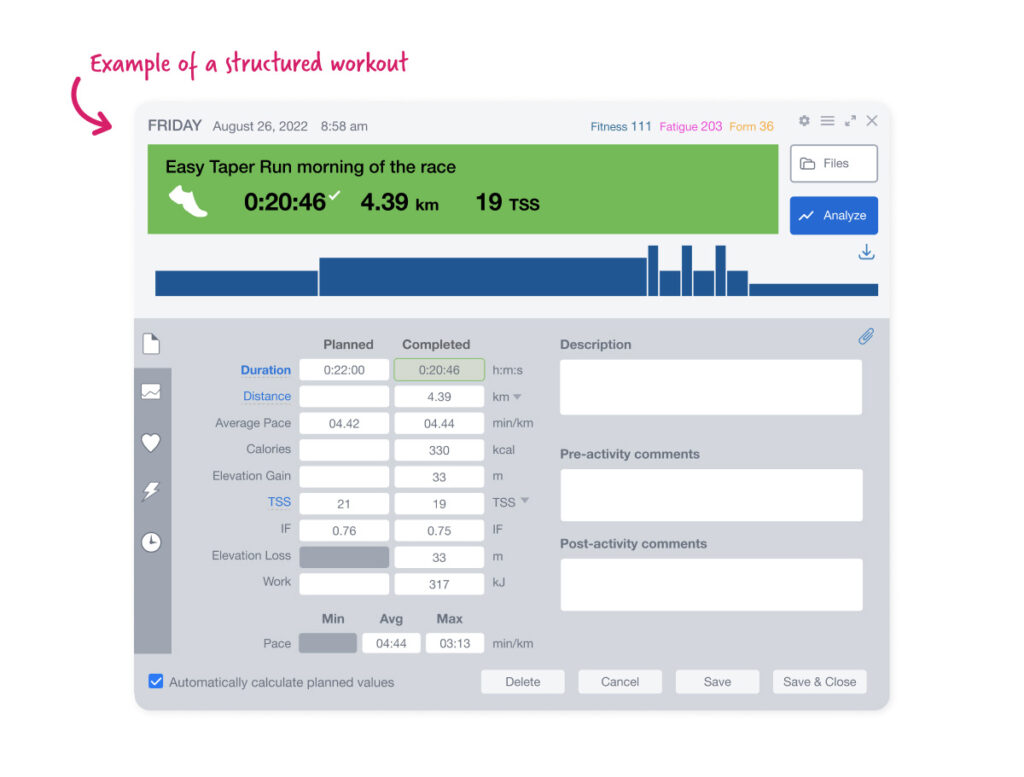
The workouts built in TrainingPeaks, based on heart rate, pace, or RPE, would then be exported automatically onto Robert’s watch on the day they were scheduled. This ensured he was training at the correct intensity. Also, during harder sessions, such as intervals, they would motivate and prompt him to push to hit the desired training zone.
I hope these metrics will help you review and refine your training for your best race yet.


