
The 2018 Tour de France is hard. It’s 21 days of racing, and each stage can range from three to six hours per day, with the individual time trial and team time trial taking around an hour each. That’s a lot of work! Most of the riders use power meters, and we often get insights into their actual data highlighting things like sprint and climbing power, but we don’t often see much about the role of fatigue in this event, or more specifically the role of a rider’s resistance to such fatigue.
Let’s take a look at the average energy expenditure during any given day at the Tour de France. Studies indicate that riders burn an average of 6,000 kcal/d (kilocalories per day)1, hitting more than 9,000 kcal/d on some days. If we assume roughly 2,000 kcal/d for non-exercise energy expenditure, this translates into doing about 3,800 – 4,000 kJ of work every single day assuming an approximate one-to-one kcal/kj conversion. With such a high physiological demand, success in a given tour stage is typically less about the riders’ raw power and more about their fatigue resistance and ability to perform under these massive workloads.
In order for riders to compete at the Tour, they need to be blessed with a natural fatigue resistance and develop it further through training. To understand this performance capability, we can use WKO4 to measure fatigue and the ability to resist it. Amber Neben, the 2016 La Route de France winner, current world TT champion, and a TrainingPeaks athlete, has allowed us to use her data to demonstrate how this is done.
Using work in kilojoules (kJ) to track work completed, we can analyze how well Amber resists fatigue in a given workout or single-day race event. I like to use a combination of the power-duration curve (PDC), mean max power (mmp), and kilojoules burned to gain visual and quantitative insight into performance ability as an athlete fatigues.
Take a look at Amber’s fatigue resistance in the chart below. As she prepared for her season, Amber participated in her team training camp in Mallorca, where she completed some pretty hard climbing efforts. In her ongoing training, we continue to enhance her ability to resist fatigue by training and tracking her ability to go hard after accumulating over 40 kJs per kilogram of body weight, which is a fair amount of fatigue.
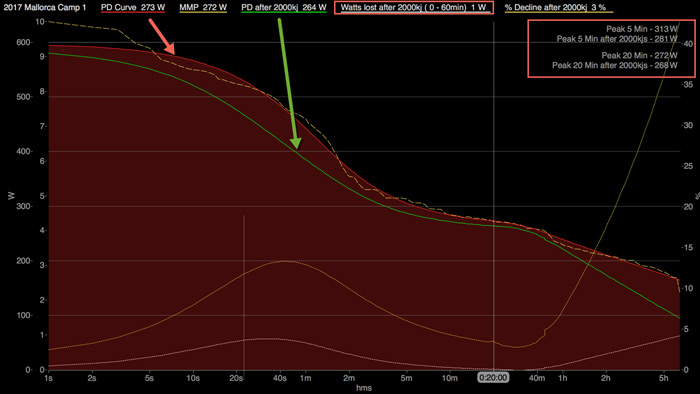
This chart contains a lot of information, but let’s focus on Amber’s 5-minute and 20-minute mean max power outputs to keep things simple. The chart compares her power-duration model (the red line vs. green line) and her mean max power outputs when fresh and after 2,000 kJs of work. To put this in perspective, Amber weighs 50 kilograms, so she needs to do about three to four hours of endurance work to accumulate 2,000 kJs.
Let’s compare some key data points for both her actual mean max power outputs (bests) and her power-duration curve (PDC) model estimates.
| Fresh | After 2,000 kJs | Variance | |
| Actual 5-Minute Best Power | 313 watts | 281 watts | 22 watts |
| PDC Estimated 5-Minute Best Power | 305 watts | 287 watts | 18 watts |
| Actual 20-Minute Best Power | 272 watts | 268 watts | 4 watts |
| PDC Estimated 20-Minute Best Power | 273 watts | 272 watts | 1 watt |
As you can see, Amber is highly resistant to fatigue and can perform at a high level even after accumulating significant amounts of work. Her fatigue resistance is a combination of natural ability, training and efficiency. Her 5-minute power during this time frame does degrade more, but this was driven by a single 5-minute power test with the team when fresh, as we did not do formal 5-minute post-2,000-kJ testing.
To put this in better perspective, let’s compare Amber’s numbers with an average rider. We’ll call him Joe Rider. Joe is a former Cat 3 racer who trains about 10 to 12 hours a week. He weighs 65 kilograms and has an FTP around 265 watts. Since he weighs 15 kilograms more than Amber, using 2,000 kJs of work (the number we used for Amber) is not an apple-to-apple comparison, as work is relative to weight, but it will give some immediate insights into just how resistant to fatigue a good pro is.
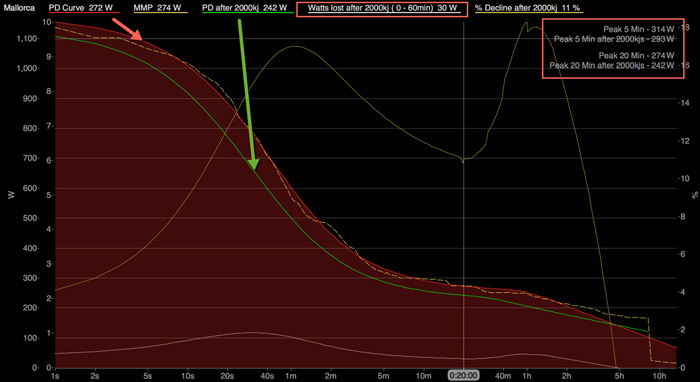
Let’s break down Joe’s numbers as we did Amber’s:
| Fresh | After 2,000 kJs | Variance | |
| Actual 5-Minute Best Power | 314 watts | 293 watts | -21 watts |
| PDC Estimated 5-Minute Best Power | 315 watts | 287 watts | -28 watts |
| Actual 20-Minute Best Power | 274 watts | 242 watts | -32 watts |
| PDC Estimated 20-Minute Best Power | 272 watts | 242 watts | -30 watts |
Joe Rider’s data is very typical representation of the dropoff I consistently see, and this shows how important fatigue resistance is too high-level success. Let’s compare him directly with Amber Neben:
| Amber Neben | Joe Rider | |
| Actual 5-Minute Best Power Loss | -22w | -21w |
| Actual 20-Minute Best Power Loss | -4 w | -32w |
As you can see, there’s a significant difference at the 20-minute power output between the pro and the average Joe, and my assumption would be that if we would have tested a fatigued 5-minute output during this time period, we would see very little degradation and a much bigger gap for the pro than for Joe.
I can recount numerous instances of this same type of fatigue resistance with young riders trying to live the dream of going pro. Many of them can hit 5.6 or more watts/kg for 20 minutes, but few—very few—can do that after 2,000-3,000 kJs, and their degradation rates are similar to Joe Rider’s. Fatigue resistance is the elite pro difference.
Let’s go back to the average daily energy expenditure at the Tour de France. Most stages are designed to finish hard and typically require highest sprint or climbing power in the final distance of the stage. Watch your favorite rider sprinting for the win or powering away on the final climb this year; when you read the power review later, you’ll probably see sprint power numbers in the 1,400- to a 1,500-watts range and climbing power north of 5.8 watts/kg. That is what it takes to be a professional rider competing at the highest level: the ability to resist fatigue while still performing at a high level.
You may be asking, “How do I build fatigue resistance?” The answer is a complex one, but here are a few training tips that might help:
Test it first. Based on your weight, complete a 20-minute test after doing 2,000-2,500 kJs of work. You can track work (or calories) on most head units, so it should be simple to know when you’ve done the right amount of work before starting the test. Then load this workout file into WKO4 and review the Fatigue Resistance dashboard.
Now that you have a baseline measurement of your fatigue resistance, you can change some training habits to improve it.
- Complete longer rides. This is a simple answer, though I realize it is hard for many Joe Riders because of limits on their training time availability.
- Move your mid-intensity interval work too late in the workout. Most recreational racers focus on doing interval work right after warm-up and then completing some endurance riding; reverse that trend. Try to build up the amount of of work you do before you complete your intervals.
- Add a “tempo home” element to your longer rides. Most recreational riders start their longer rides too hard, and their power declines over time (you can look at the Workout Power Trend Chart in WKO4 for more insight). Reverse this by doing a solid 30 to 60 minutes of tempo work as the last part of your ride.
To learn more about your fatigue resistance, download a free 14-day trial of TrainingPeaks WKO4.
References
- Saris, W.H. et al. (1989, May). Study on food intake and energy expenditure during extreme sustained exercise: the Tour de France. Retrieved from https://pubmed.ncbi.nlm.nih.gov/2744926/

