
There are few races as awe-inspiring in cycling as the Team Time Trial (TTT). Similar to the team pursuit event in track cycling, modern Team Time Trials up the ante by adding four additional riders with varying strengths and weaknesses. Riders will contend with variables associated with the course and environmental conditions—all while traveling in a tight rotating formation at speeds upward of 55 km/h.
Watching a team perform with flawless precision like Orica-GreenEDGE did in the 2013 version of the Tour (averaging a shade under 58 km/h) is a thing of beauty. But, underneath this seamless show of fluidity is a complex interplay of power, aerodynamics, timing and meticulous preparation that can set the great teams a notch above the rest.
Below we look into the anatomy of a TTT, and show how we have attempted to model these races to help teams and coaches come up with actionable insights.
So much power
In an individual Time Trial (TT) riders tend to target a steady pace at or around their Functional Threshold Power. But in a TTT, each rider will take turns pulling the group at significantly higher power for a short period of time.The goal is to keep the team’s speed consistent, but higher than any individual rider could ride alone.
Notably, at these speeds, the front rider will be pushing very high raw power, which means that their watts/kg will have a minimized impact. Disregarding aerodynamic differences for a second, on a flattish course, a smaller climber and large power TT rider have to push roughly the same power to maintain that speed when riding out front.
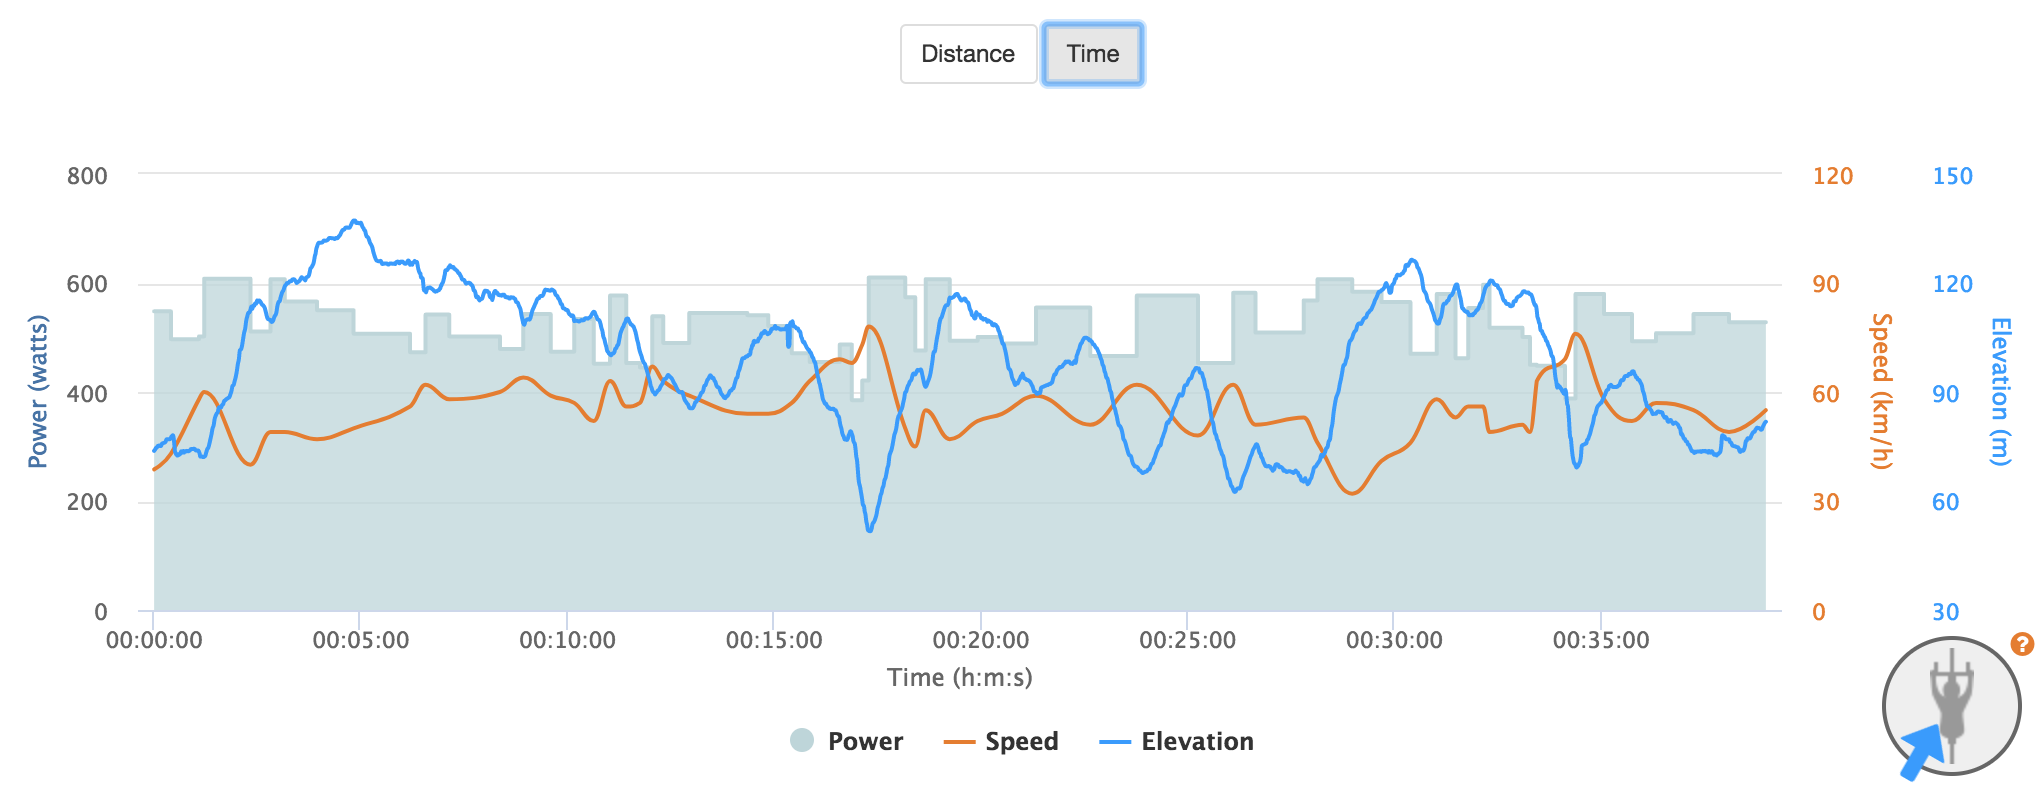
Check out this sample data file from a professional TTT rider at the world pro tour level. We can see the extreme demands associated with pull intervals, as well as the rest intervals as the athlete sits in and recovers before their next turn on the front.
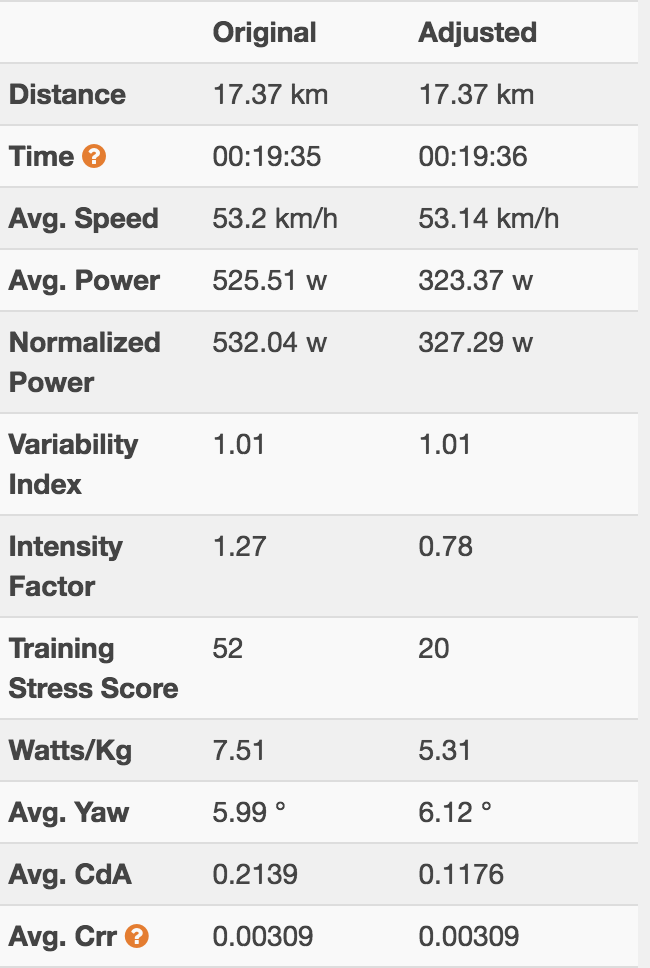
 The raw numbers of the pull phases are eye-popping and can often exceed 130 percent of Functional Threshold Power (FTP). The average pull power for the athlete above was between 525 and 540 watts, with an average duration of 30 seconds to a minute. He averaged 325 to 340 watts for his two to three “resting” minutes between pulls.
Because speed was maintained fairly consistently on each half of the course, you can assume that the pulling power was relatively consistent from rider to rider. But keep in mind, that raw power number represents a different maximum capacity of each rider’s Power Duration curve (i.e. 530 watts may be the two-minute power for one athlete whereas it could be closer to the five-minute power of another).
Each rider’s pull duration can be significantly impacted according to these individual power characteristics. Strong riders might be expected to take longer, 45 seconds to one minute pulls, whereas smaller, less powerful riders might even sit out some rotations in order to stay in contact with the group.
In the above example, the rider’s average power for the entire course was 377 watts. For some small GC climbers that could represent a higher percentage of their FTP, putting them at a significant disadvantage for this type of stage despite their superior watts/kg.
Every Aero Advantage
Of course, all this power discussion disregards what is probably the most striking visual from a TTT: The aerodynamic gear and positions. We mentioned that watts/kg is not as important in this type of race, but watts/CdA is a different story.
In other articles we have discussed the importance of CdA, (or coefficient of drag area). The faster a rider goes, the more power they need to produce to overcome aerodynamic drag. So, the more they can mitigate that drag with equipment and position, the less power they’ll have to produce.
Today, all teams and riders understand the extreme importance of aerodynamics, and spend a lot of time and resources perfecting their positions and equipment. While there are still gains to be had and well-funded teams still hold an advantage, the difference between the best and the worst in terms of aerodynamics has shrunk significantly over the years.
However for modeling purposes, it’s important to know the characteristics of riders in different positions in the train to help formulate strategy. Recent studies have shown that the aerodynamics of the group (even the pulling rider) are better than any of the riders solo. Using our Aero Analyzer Tool we can investigate the numbers and see how this could impact future races.
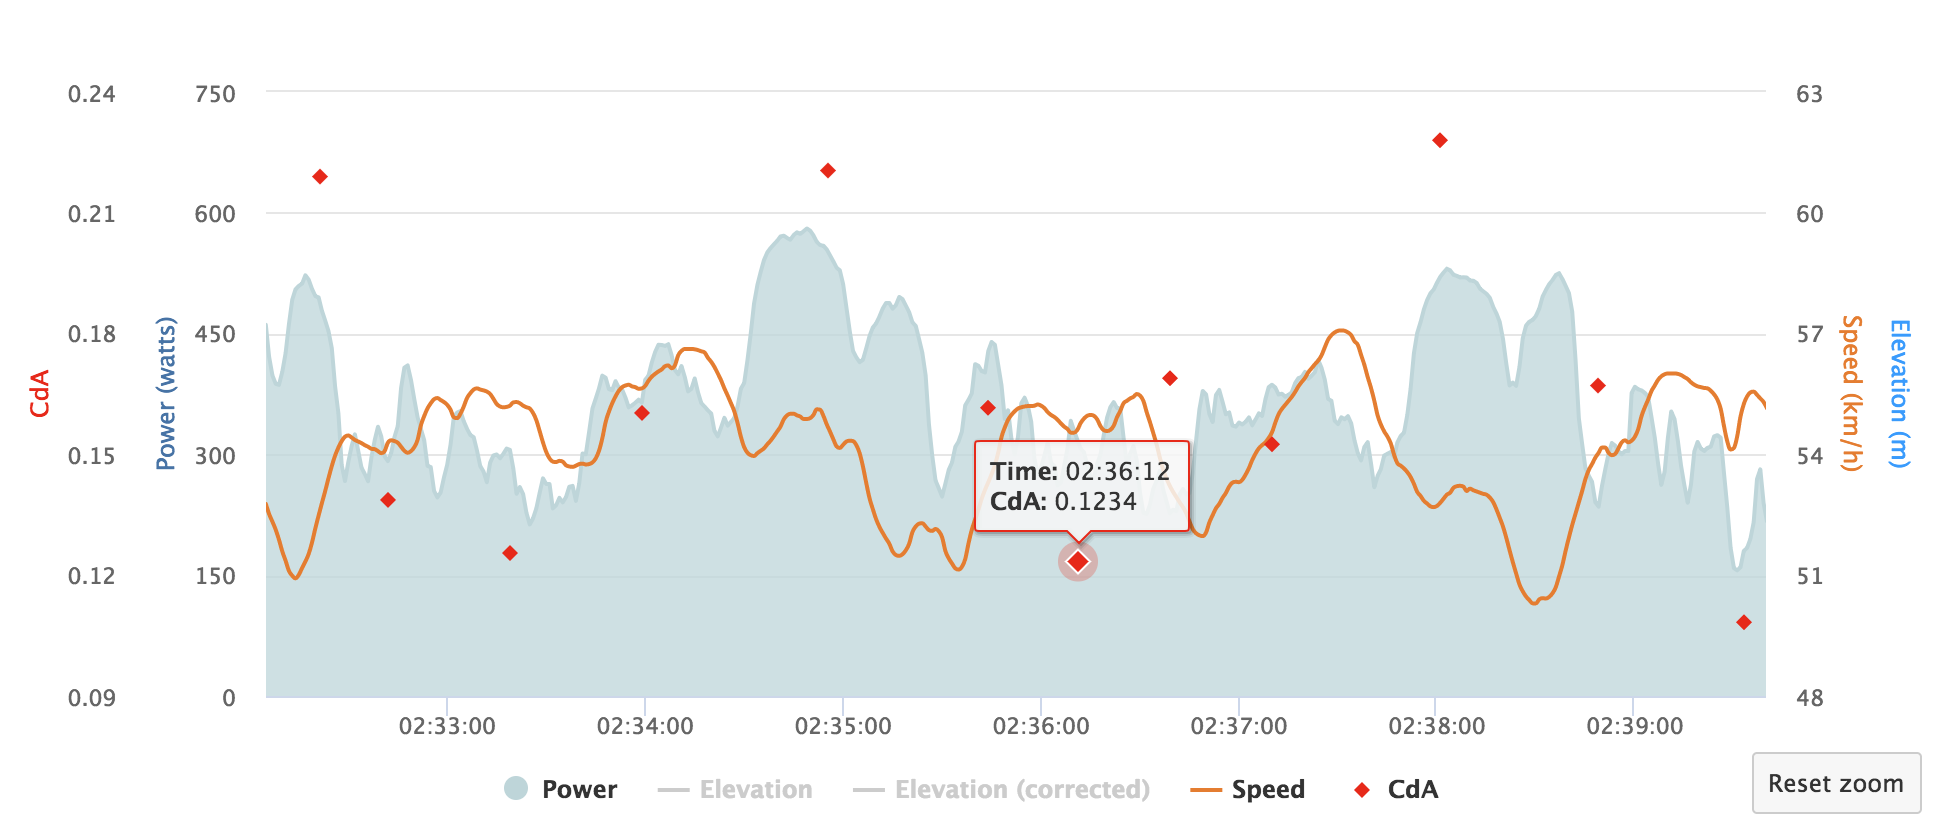 Looking at the time series data from the example above we can see the distinct difference between pull phases where CdA hovers a bit over .22 and rest phases where it drops to a low of .12, or roughly 50 percent less. The reduction also follows a pattern which bottoms outs when the rider is in the center of the team rotation. This matches recent research into drag effects on pelotons.
Now that we have some baseline details of the numbers involved in the race we can start to use that to model and find insights for future races.
Modeling stage 3 of the Tour
A couple years ago we discussed ways to model Team Time Trial races with several tour teams. The complexity is significantly higher than modeling a standard TT; however, we developed a straightforward and simple method that can still provide teams insights as it relates to course reconnaissance and weather/condition race impacts. To do this we only consider the pull phases of the race and use the lead riders’ aerodynamics data to model the race as if it was a single unit.
By doing this teams can start to see the average speed tendencies, as well as areas on the course where there may be an advantage to have stronger riders pull for different durations, and ideas about placement of key GC riders within the group. Ultimately this sort of modeling can help fine-tune their strategy going into the stage.
The goal of the model is not to tell teams the exact strategy but instead provide tools to validate ideas and give specific course insight and intelligence.
 Looking specifically at stage 3 there are two major factors that immediately stand out. First is that the modeled speed slows over the course despite an early climb. Second is that the average power increases over the course.
This is due to a forecasted strong prevailing tail/cross in the first half, which turns to headwind on the way back. Teams that push too hard over the first two checkpoints could lose significant time in the back half of the course if rider power drops.
Using the Best Bike Split Time Analysis Tool we can estimate the impact of this. Pushing 5 percent more power on pull phases can shave 20 seconds off the time in the first half whereas fading by 4 to 5 percent in the second half results in 30+ seconds of lost time.
Saving stronger riders for the back half combined with the rolling nature of the course can also have the added benefit of allowing smaller GC riders sit in for longer at reduced power to minimize the risk of losing or having to slow down for key riders.
Finally, in the TTT, the time stops when the fifth rider crosses the line. For some teams it may make sense to shed riders at a key area to propel the team to the victory or for a GC rider to save some precious seconds.
In the closing sections of stage 3, if there the wind predictions hold, there is a section where a large effort can result in a meaningful time gains.
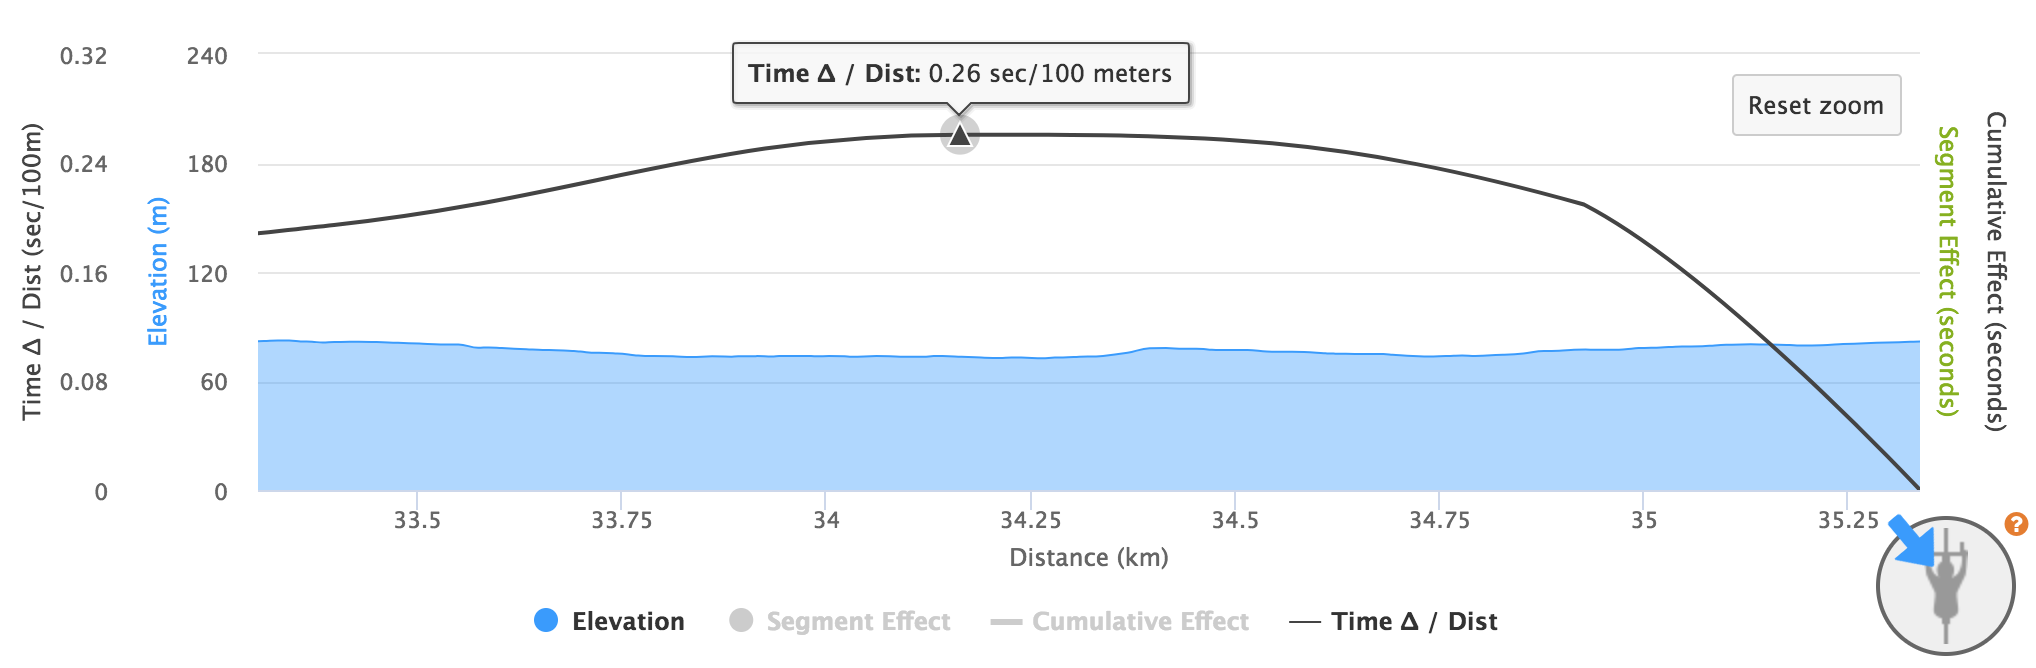 Using the Time Analysis Tool’s Time Delta metric, we can see that maximum effort from 33.5 to 35 km can gain .26 seconds per hundred meters over a faltering pace.
Where every second counts over a three-week race, modeling doesn’t always provide the perfect answer, but it allows teams a deeper insight into a course than previously possible.
To try for yourself checkout out our Stage 3 coverage and use the Time Analysis tool to look at different scenarios for this year’s TTT.

