Stage Overview
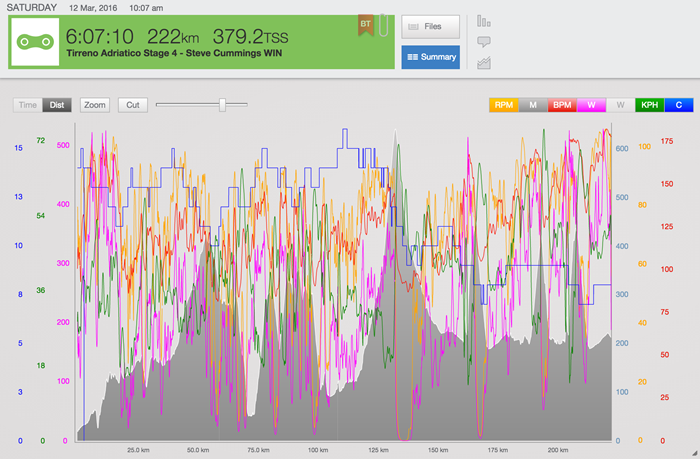
The 222km stage started with an early break going clear in the opening kilometres of the race. The breakaway got a maximum lead of 5 minutes but was reeled in with around 30km to go. This final section of the route included 2 short climbs on which the pace ramped up significantly.
By the time the front group went over the final climb of the day at 15km to go, there were only 40 riders remaining including Edvald Boasson Hagen, Steve Cummings, and Natnael Berhane representing Team Dimension Data for Qhubeka. Attacks started to fly from the front group with Cummings and Berhane covering each one, hoping to keep the race together for Boasson Hagen.
Salvatore Puccio (SKY) then put in a telling attack with 6km to go which Cummings and Matteo Montaguti (Ag2R) responded. The trio got a 10-second gap before 3 riders jumped the gap to join them, Berhane was part of this move placing our African Team in a great position with 2 riders in the lead group of 6. The chase never seemed to come from the peloton and so with 3km to go, Cummings saw his opportunity, attacked, and time trialed to a great solo win.
Stage Summary Data
- Duration: 6:07:10 Distance: 222km
- Training Stress Score®: 379.2
- Normalized Power®: 315 watts
- Average Power: 227 watts
- Average Heart Rate: 128bpm
- Average Temperature: 12C
- Energy Expenditure: 5015 calories

Figure 1: Steve Cummings Data File for Stage 4 Tirreno-Adriatico 2016
Workload Management and Efficiency
As all experienced pro cyclists know, energy management and efficiency during World Tour level stage races are the key to successful performances. Cummings’ data from this stage provides clear evidence of his smart and efficient approach to racing.
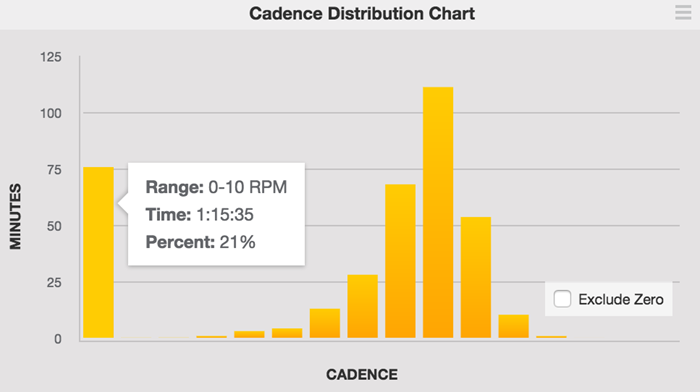
Cummings’ summary data from the stage show that he coasted (cadence 0-1-rpm) for 1:15:35 (21% of the total time) of the total race.

Figure 2: Cadence Distribution Chart
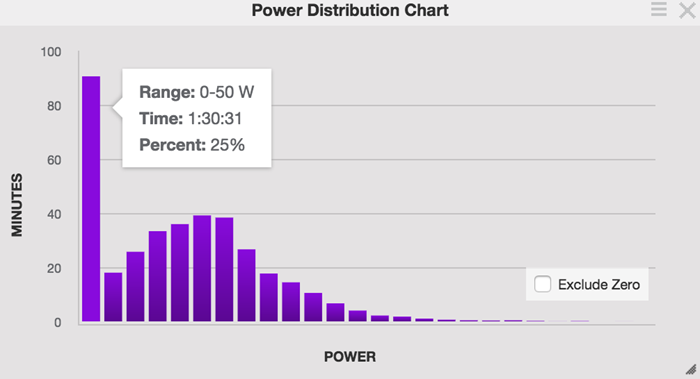
He also spent 2:14:14 (37% of the total time) at a power of 0-150 watts i.e. in his recovery zone. Of this, 1:30:31 (25%) of the race was at 0-50 watts, i.e. coasting.

Figure 3: Power Distribution Chart
Conserving Energy
In the first two thirds of the race, Cummings rode conservatively knowing that the race outcome would be determined over the final climbs. Compared to the first 2/3 of the race, in the final third of the race his average power increased by 36%, average heart rate increased by 30%, and his energy expenditure and work (calories) increased by 30%.

Final Climbs
Because of his conservative and efficient approach to the early part of the race, Cummings was able to deliver a high workload over the final three climbs (3 x 10 minutes at 400-450 watts) which reduced the lead group to only 40 riders.

The Winning Move
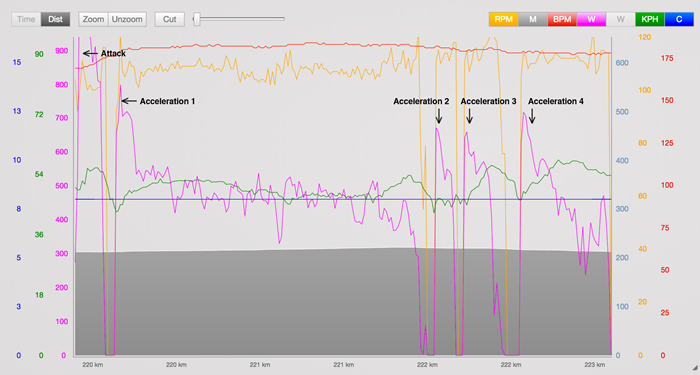
At 3.2km to the finish Steve put in an eleven second attack (average power 893 watts, maximum power 1244 watts) and time trialed to the finish line in textbook winning style. During his 3 minute 46 second solo effort, he averaged 451 watts and accelerated hard through the final corners as shown in Figure 4. His ability to produce these powers at the end of a 6 hour stage, in stage 4 of a World Tour stage race speak to his talent, form, efficiency, and experience.
- Acceleration 1: 24 seconds, averaging 588 watts
- Acceleration 2: 8 seconds, averaging 549 watts
- Acceleration 3: 11 seconds, averaging 507 watts
- Acceleration 4: 15 seconds, averaging 571 watts
Conclusion
Winning a stage like this requires knowing when to use your strengths. Cummings is great when it comes to knowing how to ride within himself and not letting other riders determine the rhythm he has to ride at. We saw this at stage 14 of the Tour de France in 2015 where he bided his time, before making his move in the last kilometers of the stage. He did the exact same thing in Tirreno-Adriatico.
The data was analysed in TrainingPeaks, the Official Training Software of Team Dimension Data for Qhubeka. This article was prepared by Trevor Court and Dr Carol Austin.


