
After putting in months of diligent base training, your racing season approaches. If you’re like most athletes, you don’t spend that much time thinking about the training process because you’re just training for fun, following a training plan, or paying a coach to figure out your workouts so you don’t have to. Still, the basic training process isn’t that complicated, and it’s worth taking a look at, as you’ll see below.

Most coaches follow this coaching process to produce peak performance in an athlete:
- Determine an athlete’s strengths and weaknesses with respect to event demands
- Manipulate the intensity and volume of training to produce specific adaptations
- Manage Chronic Training Load (CTL, or Fitness), Acute Training Load (ATL, or Fatigue) and Training Stress Balance (TSB, or Form) to produce peak performance when it matters
As an athlete, what you probably notice the most during the build period is the ‘Manipulate’ column. Why? Because workouts get harder and longer, and you get tired!
Or, to use the language of the model, during the build period, your workouts get harder (intensity goes up), and sometimes the duration (volume) of your workouts also goes up, which results in the highest (or nearly the highest) training load of the year. Because you’re accumulating more fatigue than normal, you’re tired.
The temptation for athletes to train themselves ragged is always a danger because they think that the more fatigue, the greater their performance — wrong! The chronic accumulation of training stress (i.e., CTL) is an athlete’s potential for performance. Achieving peak performance requires careful, specific loading and unloading of training stress to maximize the body’s adaptation. If you train too much or too little, your performance won’t be optimal.
So, how can an athlete optimally manage training stress through the build period to produce their best performance on race day?
Understanding the Influence of Life Stress on Athletic Performance
CTL, ATL, and TSB are all worthy things to know and manage; but as an athlete, you’re much better off understanding, measuring, and managing something the training process model doesn’t mention — Total Life Stress.

Total Life Stress (TLS) is all of the stress an athlete experiences in life regardless of source, which can include training, work, relationships, diet, environment, lifestyle, etc. Athletes sometimes struggle to realize (or admit) this, but training stress isn’t the only factor affecting performance. Every other stressor in life affects performance as well — sometimes even more than the training itself! Your body doesn’t differentiate between the source of your stress, so stress outside of training is a crucial variable to manage if you want to get optimize your training and perform your best.
To manage something, however, you need to measure it. Thankfully, you can objectively quantify your TLS using heart rate variability (HRV). While HRV isn’t a perfect way to model TLS, adjusting your lifestyle to in response to HRV can produce better workout execution and adaptation in the build period, which increases the chances of better performance outcomes come race day.
What Is HRV?
First, let’s do a brief rundown of heart rate variability. Your heartbeats are not consistent or consistently spaced; there are (normal) fluctuations in the amount of time between them. This variation in heart rate is known as heart rate variability, or HRV, and it is measured in milliseconds.
HRV measures the interplay between the parasympathetic and sympathetic branches of the autonomic nervous system (ANS) which is responsible for physiological processes you have no control over directly.
The parasympathetic nervous system (PNS), nicknamed ‘rest and digest’, allows you to recover and causes an increase in heart rate variability. By contrast, your sympathetic nervous system (SNS), nicknamed ‘fight or flight’, allows you to respond to stress and causes a decrease in heart rate variability.
Both systems send signals to your heart asking it to slow down (PNS) or speed up (SNS) depending on what you’re doing (e.g. sitting on the couch, VO2 max intervals, etc). The competing signals cause fluctuations (i.e., the variability in heart rate variability).
A high HRV indicates that your ANS is robust, well-balanced, and ready to respond to stress. A low HRV indicates an imbalanced ANS that is less responsive to stress.
How to Measure HRV
The most common way athletes measure HRV is by using a heart rate monitor, a wrist-based optical heart rate monitor, or a smartphone app. HRV sensors and apps also measure resting heart rate, which is best used as an indicator of increased aerobic fitness. The raw HRV data can be difficult to interpret, so most apps convert it to a more easily interpretable score. These scores aren’t necessarily interchangeable between apps and devices but are all useful when used consistently.
For HRV and resting heart rate to be meaningful, you must take measurements at the same time and in the same way every day to develop a baseline of data. With enough data, you can see trends in your HRV and, by proxy, your TLS.
TrainingPeaks is compatible with popular HRV apps like HRV4Training, SweetWater, WHOOP, and EliteHRV. To get your HRV data syncing to your TrainingPeaks athlete account, visit our complete list of compatible apps, find your HRV software, and follow the instructions to authorize the sync from the HRV software to TrainingPeaks. Once authorized, the next time you record your HRV the values will automatically sync to your TrainingPeaks athlete account and appear in a metric card on your TrainingPeaks athlete calendar. If you have a Premium account, you can click on your “Metrics” cards to visualize how your HRV has changed over time.
How to Interpret HRV
Once you obtain a baseline HRV, what should you take away from your data? Understanding how to interpret HRV can help an athlete in many ways.
A healthy, resilient athlete will enjoy a high, relatively unvarying HRV combined with a stable, low resting heart rate (RHR). An unhealthy, sickness-/overtraining-/injury-prone athlete will have lower, volatile HRV readings. The heart rate variability chart below provides an easy-to-understand visual.
Heart Rate Variability Chart
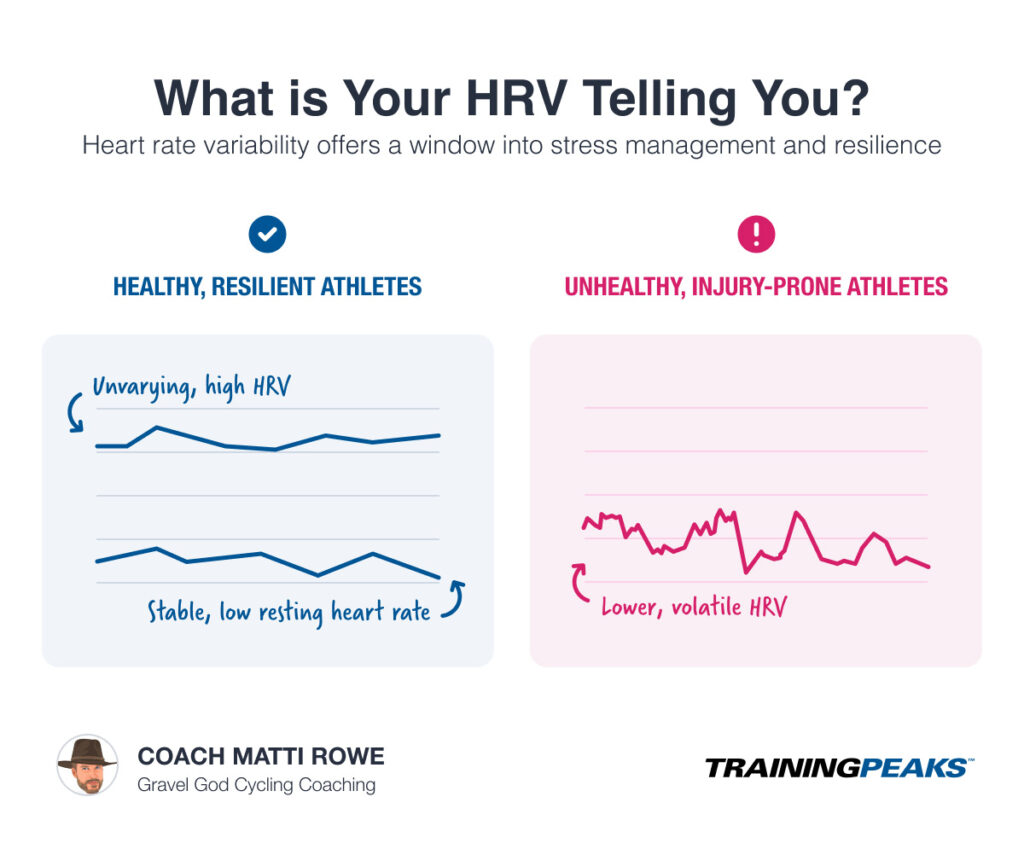
Here are a few additional HRV facts to keep in mind:
- HRV does not predict performance; instead, it’s a window into fatigue. You can regularly perform well even when fatigued (e.g., if you wake up with a low HRV reading), but remember that for adaptation to occur, you must recover.
- If your HRV remains within a normal range after you complete a hard workout, that’s a great sign! A stable HRV demonstrates that your nervous system can absorb the stimulus.
- HRV reflects the nervous system, so it won’t necessarily correlate with other training stressors, like delayed-onset muscle soreness (DOMS).
- When athletes begin to measure HRV, they naturally wonder how their score compares to that of other athletes. While this can be useful, realize that gender, age, health, and fitness levels complicate direct comparisons. For reference, here’s an excellent review of HRV demographics to see how your HRV values compare.
- While more rare, a single HRV reading that is much higher than normal can also indicate fatigue.
- If you’re interested in more in-depth information about HRV, check out this TrainingPeaks University course.
The fun part about monitoring your HRV is that you can start to experiment on yourself. Once you have an HRV baseline, you can start altering your habits to decrease TLS and then confirm if those changes are working by monitoring trends in your HRV and RHR. If you consistently reduce your TLS, you’ll be able to sustain and adapt to the high training load of your build period and perform better on race day.
Key Factors That Affect Heart Rate Variability and Stress
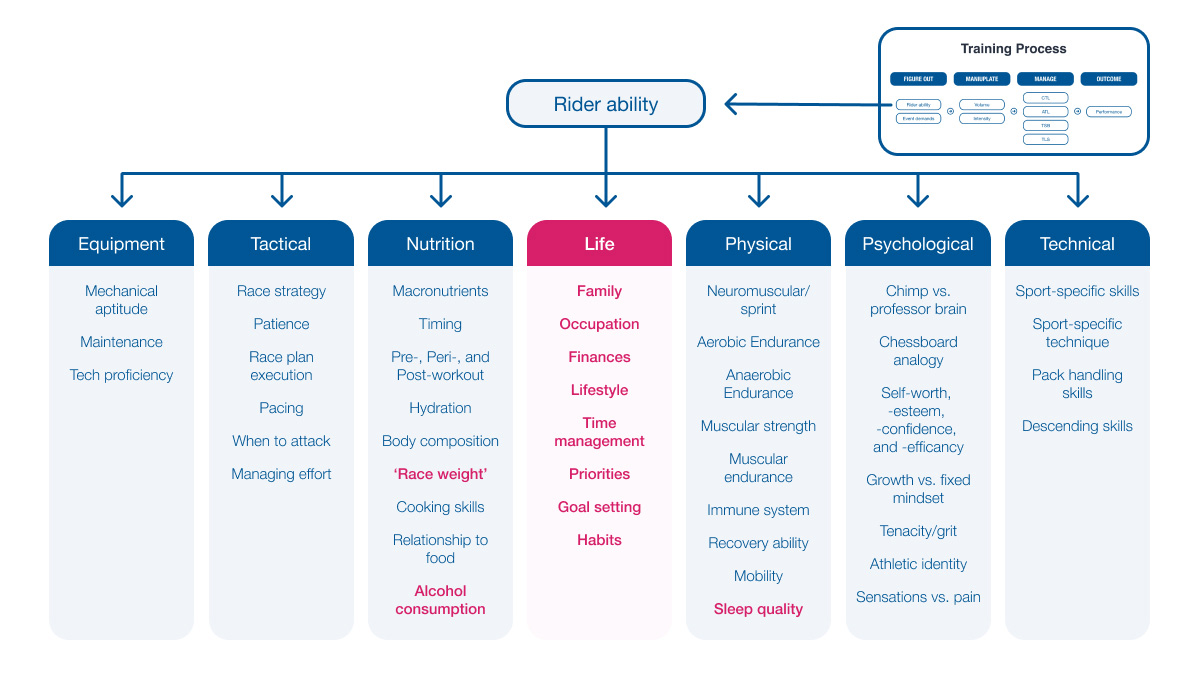
The graphic above shows “Rider Ability” broken out of the Training Process framework and expanded into other subcategories. The subcategories and factors within the subcategories are not exhaustive, but they’re a useful starting point to determine what lifestyle factors contribute the most to your TLS. What lifestyle factors hold you back the most? How can you reduce the stress related to these factors so that your TLS decreases, allowing you to perform better?
The answer for you is individual. However, I’ve highlighted lifestyle factors I often see holding athletes back in the build period in red. These include life, sleep, nutrition, and alcohol consumption. Let’s dive into each of these topics to see common HRV trends and how you can reduce related stress for better performance.
Life
As a coach, the most important subcategory of rider ability besides “Physical” that affects performance is “Life”. Why? Alan Couzens put it best: “The athlete chooses the type of life they want to live and that, in turn, determines the load they’ll be able to absorb.”
If you’re like most athletes, you’re not paid to race. Instead, your priorities look something like this:
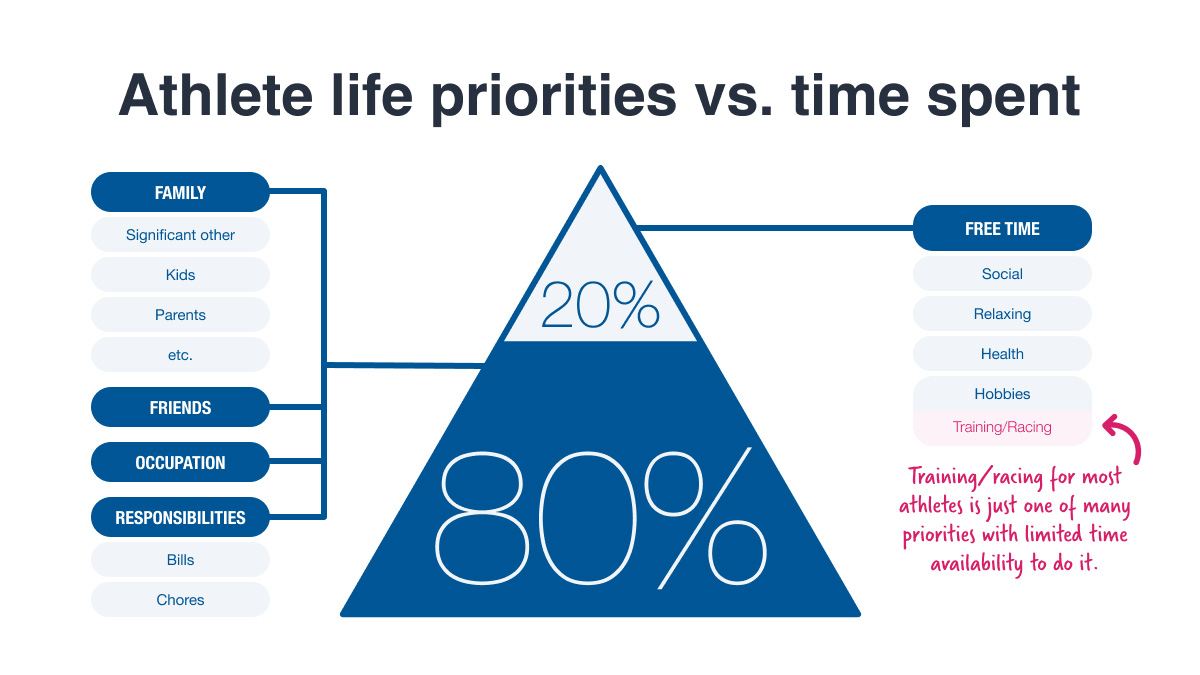
Consequently, your ability to execute and adapt to training — especially the intense, demanding training in a build period — depends on the stability and balance of your priorities that take precedence above training. These priorities include your relationships, career, financial responsibilities, etc. If you can identify potential stressors in these areas, you can develop a plan to mitigate the issue before it adds enough stress to your TLS that it negatively impacts your training in the build period.
For example, during a build period, your relationships with significant others and friends tend to get pushed aside by training and racing demands, leading to resentment and deterioration.
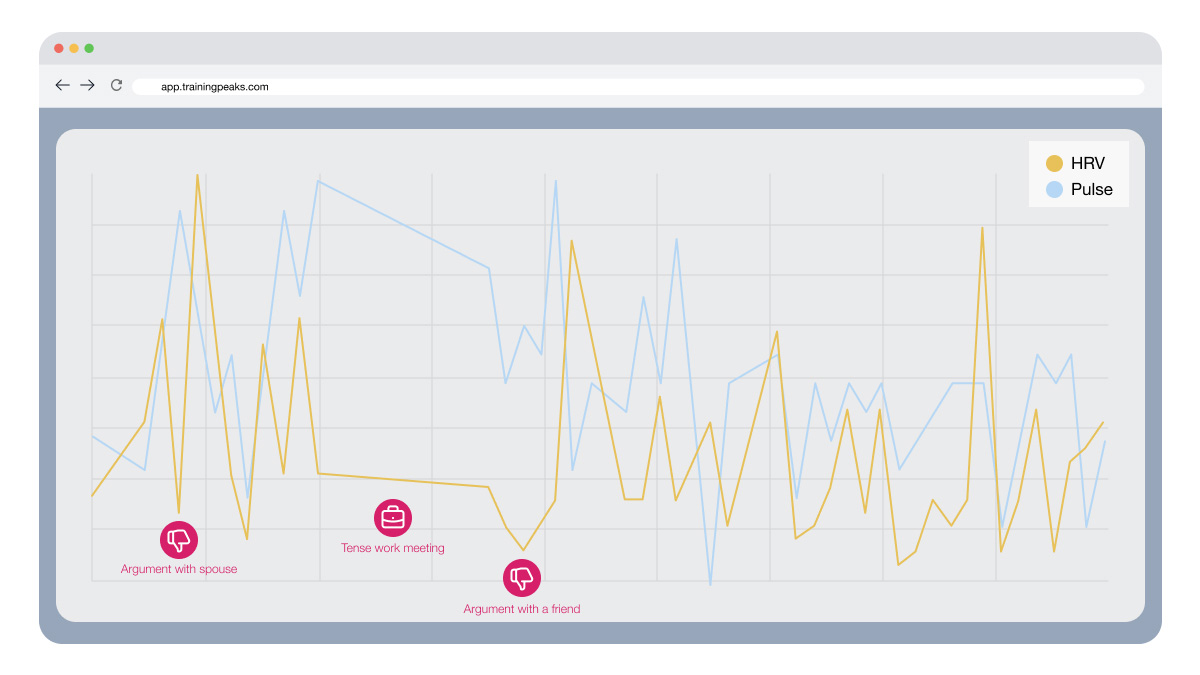
Your HRV may reveal some of the stress of that friction. As you can see in the illustration above of one of my athlete’s HRV, their HRV (yellow line) was highly variable and generally trending downward, indicating high TLS. At the time, the athlete was going through considerable professional change, which added a lot of stress to their life and led to relationship conflict. While the athlete was entering an important training period for the season, they had to adjust their build and instead prioritize stress reduction for a chance to succeed.
Interestingly, looking at the athlete’s TrainingPeaks calendar wouldn’t have uncovered the TLS they were enduring — their workouts were completed and executed well, for the most part. Keeping an eye on HRV combined with honest communication revealed their true TLS and helped them avoid a negative outcome.
Nutrition
Achieving “race weight” is an almost universal aspiration for endurance athletes. While there’s nothing wrong with optimizing your body composition, your dieting approach and timing can undermine your training, adaptation, and ultimately your performance.
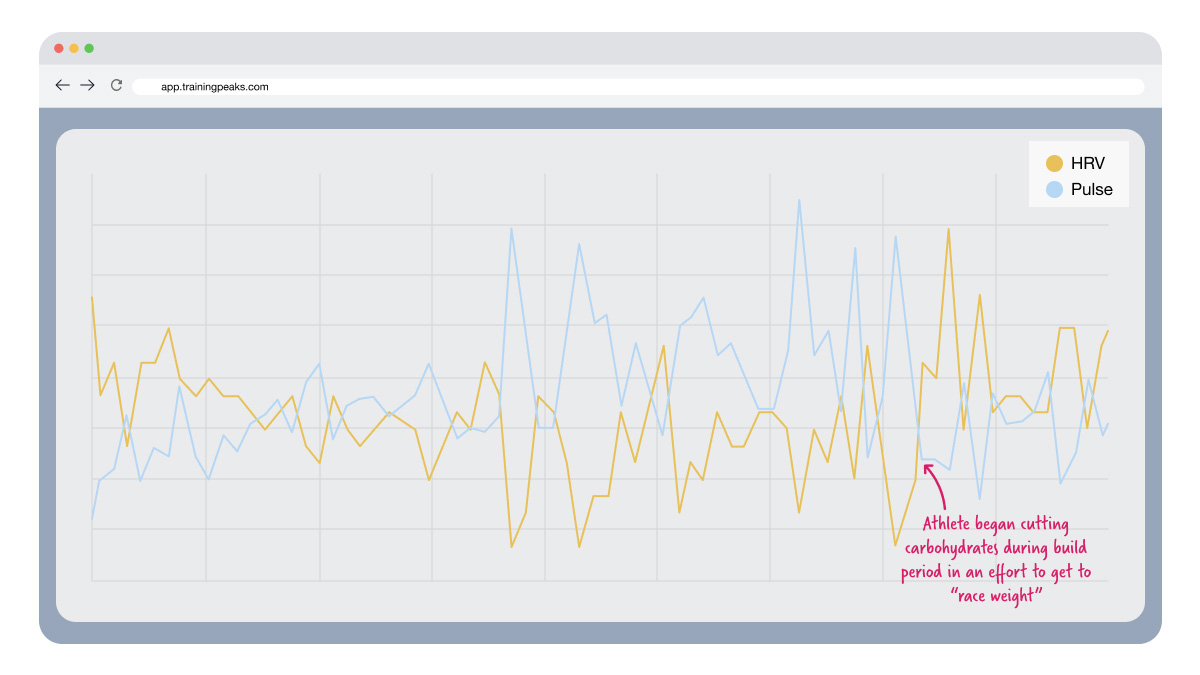
While small nutritional changes aren’t always apparent in HRV, dramatic nutritional shifts often are. Above, you can see one of my athlete’s HRV (yellow line) and resting heart rate (blue line) in their build period. Both were trending well initially, but suddenly, a drop coincided with poorer training quality.
On our monthly phone call, I asked what they thought the issue was, and they admitted they were avoiding carbohydrates to lose a couple of pounds. As you can see, the stress of that dietary change combined with a high training load clearly showed up in their HRV and resting heart rate.
Thankfully, we were able to have a constructive discussion about when and how to work on body composition changes, helped in part by showing them the above graph, which clearly showed the impact it was having on their TLS.
There’s a time and place for you to experiment with your diet, but it should never coincide with the build period when energy demand is highest.
Alcohol
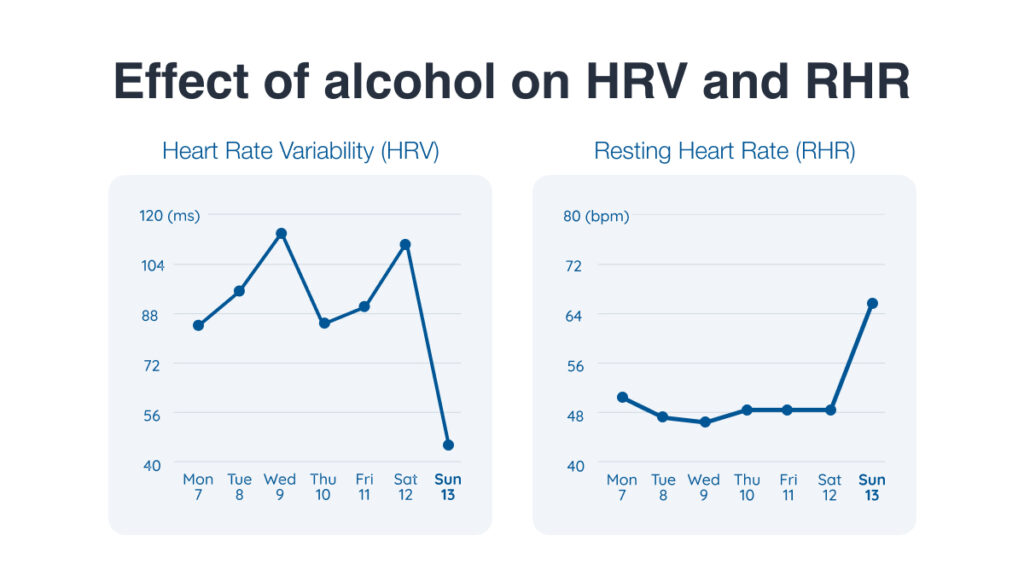
According to a study published in Medicine & Science in Sports & Exercise, if you’re an endurance athlete, you’re more likely to drink alcohol. While athletes often delude themselves into thinking that alcohol doesn’t negatively affect performance, HRV objectively confirms what an athlete’s hangover is already telling them — alcohol tanks recovery and performance.
How much does alcohol impair recovery? Here’s an example from one of my athletes after one big night out. As you can see, their HRV sharply dropped, and their RHR sharply increased.
Recovery is even more critical to your success in the build period because of training load demands. TrainingPeaks published a popular article about alcohol and recovery before, but it bears repeating that many athletes — masters athletes, in particular — regularly consume enough alcohol to negatively affect their recovery.
Amongst my athletes, the two most common reasons cited for drinking are moral licensing and stress relief. Moral licensing is a phenomenon whereby we falsely believe that one good action can excuse or negate a bad action. For example, imagine you train for five hours and then drink four beers because you ‘trained a lot today’.
While there’s some truth to the health-buffering effects of training, it’s wishful thinking to believe that your ride will cancel out your drinking. It’s not an exaggeration to point out that when you drink, you’re essentially poisoning yourself. Your body drops everything to process the alcohol and flush it out of your system before it resumes any other tasks, like replenishing your glycogen stores or repairing all the muscular and metabolic damage you created during your five-hour training day. In other words, drinking isn’t canceled out by the stress of your ride; it adds to the stress of your ride. If alcohol consumption is chronic, you will never train and race to your potential because your recovery is always compromised.
Second, most athletes don’t train or race for a living and have demanding, stressful lives. To relieve the stress, they drink. While that’s understandable, it’s easy for alcohol to become their only stress-coping mechanism while never working to reduce the cause of the stress or find different ways to relax.
How can you reduce your alcohol intake so your training and recovery during the build period improve?
- Begin a sober challenge: Challenge yourself to the equivalent of “Sober October”.
- Switch to non-alcoholic: Don’t roll your eyes — NA is no longer just O’douls. It’s an exploding industry offering non-alcoholic beverages with more than passable drinkability.
- Embrace moderation: If you aren’t open to teetotaling, consider sticking to CDC guidelines, which recommend a maximum of two standard drinks per day for men and one for women. Simply moderating your consumption can sometimes trigger a massive improvement in execution and adaptation.
If you aren’t open to changing your drinking habit, that’s fine — just realize regular consumption of alcohol will have a detrimental effect on the quality of your build period and, eventually, your performance.
Sleep
Lastly, poor sleep will always limit your potential, but it can especially hinder your progression in the build period. Sleep is the most important driver of recovery. If you skimp on sleep, you are unwittingly (or wittingly!) agreeing to compromise your ability to adapt to your training.
Conveniently, many devices and software that calculate HRV also collect extensive sleep data. As reviewers like DC Rainmaker have pointed out, the validity of this data collection can be questionable. Still, I’d suggest that your sleep data doesn’t have to be perfect to be helpful. If you upload your HRV and sleep data to TrainingPeaks, you can create a dashboard chart to estimate how much you’re sleeping and if it might be limiting you.
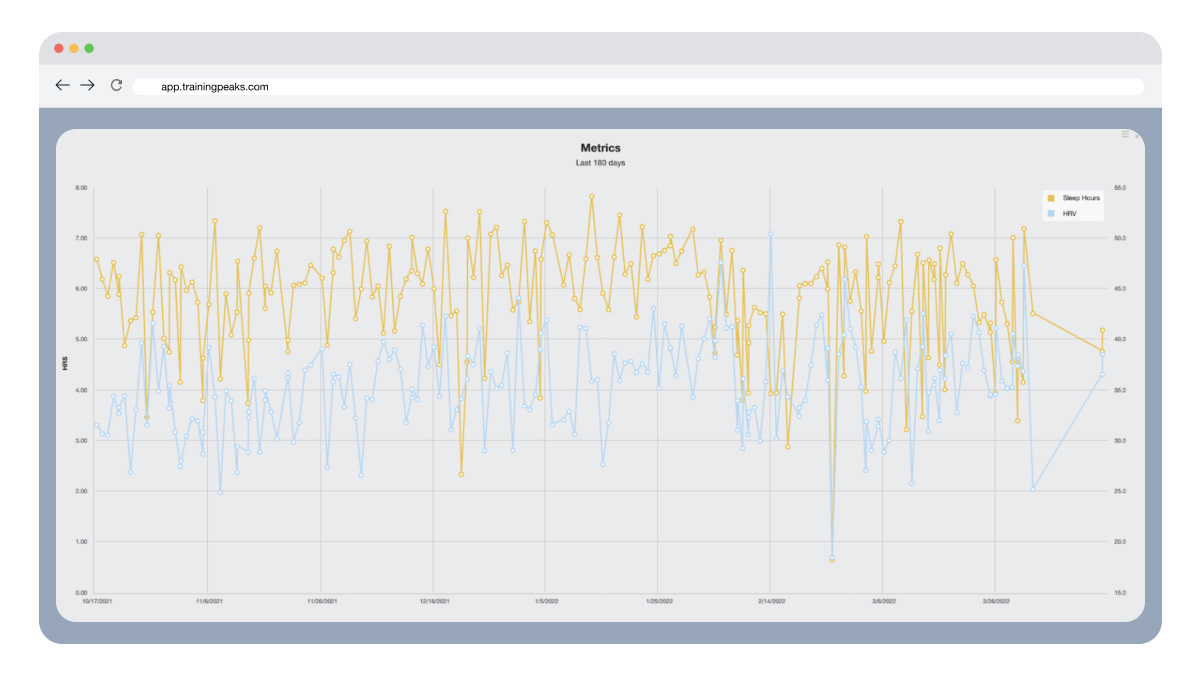
For example, in the chart above I observed a low HRV in an athlete who consistently commented that he was fatigued. Since his HRV software also captures sleep time, I was able to quickly see that he simply wasn’t sleeping enough to support his training load (he was only averaging five to six hours of sleep every night). Even if the sleep data was off by an hour, it was safe to hypothesize that his total sleep time was impairing his recovery.
Evaluating your sleeping habits is always a good place to start if you feel chronic fatigue. It’s true that some athletes have chronic sleeping issues or lead such busy lives that they really can’t sleep more. Still, in many cases, the main culprit is an obvious bad sleeping habit, like being a victim of Netflix’s automatic “next episode” feature. If you can improve your sleep, it’ll quickly benefit the quality of your build period.
How to Improve Your HRV Naturally
Increasing your baseline HRV is a sign of a healthier, more resilient autonomic nervous system. The strategies to improve it are fundamental pillars of athletic performance and overall well-being. Consistency in these lifestyle habits yields the most significant long-term results.
Focus on these key areas to naturally boost your HRV:
- Prioritize Sleep Quality and Quantity: This is the single most effective tool. Aim for 7-9 hours of consistent, uninterrupted sleep. Your body performs critical recovery functions and rebalances the nervous system during deep sleep stages.
- Manage Your Training Load: Avoid abrupt, massive increases in volume or intensity. Follow a periodized plan that includes recovery weeks. Chronic overtraining is a primary driver of a suppressed HRV.
- Optimize Nutrition and Hydration: Eat a balanced diet rich in whole foods. Avoid excessive alcohol and processed foods, which are inflammatory and disrupt sleep. Maintain proper hydration, as even mild dehydration is a physiological stressor.
- Incorporate Stress Management: Practice techniques like meditation, deep breathing exercises (e.g., box breathing), or spending time in nature. These activities actively stimulate the vagus nerve, the primary driver of the parasympathetic “rest and digest” response.
- Use Low-Intensity Recovery: Regularly include easy active recovery sessions to promote blood flow and parasympathetic activity without adding significant training stress.
Breathwork and Meditation
Breathwork and meditation are among the most powerful and direct methods for improving your Heart Rate Variability. These practices are not just for mental relaxation; they are active interventions that allow you to consciously influence your autonomic nervous system and enhance your parasympathetic tone.
The key mechanism is the stimulation of the vagus nerve. This major nerve is the primary driver of the parasympathetic “rest and digest” system. Slow, controlled, diaphragmatic breathing directly activates the vagus nerve, sending a signal to your brain and heart to calm down.
This process enhances a phenomenon called Respiratory Sinus Arrhythmia (RSA), which is the natural variation in heart rate that occurs with breathing. As you exhale slowly, your heart rate naturally decreases. By intentionally prolonging your exhalation through practices like box breathing (inhale-hold-exhale-hold for 4–6 seconds each) or resonance frequency breathing (about 5–6 breaths per minute), you maximize this variation. This active increase in heart rate variation during the practice helps train your nervous system to be more resilient and adaptable over time.
Incorporating just 5 to 10 minutes of focused breathing into your daily routine, especially before bed or upon waking, can significantly increase your baseline HRV, lower perceived stress, and improve sleep quality. It is a potent, zero-cost tool for accelerating recovery.
Best HRV Monitors and Trackers
The accuracy and consistency of your HRV data depend entirely on the device you use. The market offers a range of options, primarily falling into two categories: Electrocardiography (ECG) and Photoplethysmography (PPG).
1. ECG Chest Straps (The Gold Standard)
These devices measure the electrical activity of your heart directly, providing the most accurate and reliable R-R intervals for HRV calculation. They are the preferred choice for precise morning readings.
- Top Examples: Polar H9/H10, Garmin HRM-Pro
- Best For: Athletes and coaches who demand the highest data fidelity for making critical training decisions. A short, 1–3 minute reading upon waking is a common and effective protocol.
2. PPG Wearables (Rings, Bands, and Watches)
These devices use optical sensors to detect blood volume changes in your capillaries, which correspond to your heartbeat. While historically less accurate than ECG, modern algorithms have made them incredibly valuable, especially for tracking trends 24/7.
- Top Examples: Oura Ring, Whoop, and smartwatches like the Apple Watch and higher-end Garmin models
- Best For: Convenience and tracking overnight HRV and long-term trends. They automatically capture data while you sleep, providing a great overview of your recovery without requiring a manual morning measurement.
The best monitor is the one you will use consistently. Whether it’s a precise morning ECG reading or an automated overnight PPG trend, consistency is key to establishing a reliable baseline.
Conclusions About HRV, Stress, and Athletic Performance
Achieving the greatest performance from your build period requires more than knocking out your workouts. You also have to manage your TLS to maximize your adaptation.
To do so, watch your HRV trend. Is it stable and increasing, or is it variable and decreasing? If your HRV trends are poor, what lifestyle factors might be contributing to the decrease? What adjustments can you make to produce better results?
The key to your breakthrough in performance might not be perfectly executing your workouts, but instead managing all of the lifestyle factors that training and adaptation depend upon.
FAQs
A higher HRV is generally better, indicating your autonomic nervous system is balanced, and your body is well-recovered and resilient to stress.
HRV is highly individualized and declines naturally with age; a 25-year-old might average 60-100 ms, while a 55-year-old might average 25-45 ms.
Not necessarily. While an HRV of 30-40 ms might indicate overtraining in a young athlete, it can be a perfectly normal, healthy baseline for someone over the age of 50.
There is no universal “danger” number, but a severe, sudden drop below your personal baseline often signals acute illness, severe overtraining, or chronic psychological stress.
Yes, the Apple Watch and other modern wearables use photoplethysmography (optical sensors) to track HRV accurately, usually taking the best background readings while you sleep.
References
Altini, M. (2018, October 12). Heart Rate Variability (HRV) features: can we use SDNN instead of rMSSD? A data-driven perspective on short term variability analysis. Retrieved from https://www.hrv4training.com/blog/heart-rate-variability-hrv-features-can-we-use-sdnn-instead-of-rmssd-a-data-driven-perspective-on-short-term-variability-analysis
Centers for Disease Control and Prevention. (2022, April 19). Dietary Guidelines for Alcohol. Retrieved from https://www.cdc.gov/alcohol/fact-sheets/moderate-drinking.htm
Lezama, S. (2022, March 11). What is Heart Rate Variability? The Definitive Guide to HRV. Retrieved from https://elitehrv.com/what-is-heart-rate-variability
Shuval, K. et al. (2022, January 1). Fit and Tipsy? The Interrelationship between Cardiorespiratory Fitness and Alcohol Consumption and Dependence. Retrieved from https://pubmed.ncbi.nlm.nih.gov/34431829/
Van Deusen, M. (2021, August 11). Everything You Need to Know About Heart Rate Variability (HRV). Retrieved from https://www.whoop.com/thelocker/heart-rate-variability-hrv/


 Telling You?")


