Team Results:
1 BMC Racing Team 0:38:46
2 Team Sky 0:00:04
3 Quick-Step Floors 0:00:07
Stage 3 was always going to be pivotal in the first week of the Tour de France, with the main GC contenders’ teams going head-to-head prior to the mountains. With so many GC riders having lost time due to early crashes and mechanicals, the Team Time Trial gained even more significance. Ultimately BMC proved to be the world’s best TT team once again, winning the stage by a slender margin to Team Sky and getting Richie Porte some time. Yet the GC standings remain close, with the top five teams finishing within 11 seconds of each other.
(See Best Bike Split Analysis)
Rider Analysis: Simon Clarke
Team Finish Position: 6th +35sec
Click HERE to view the file
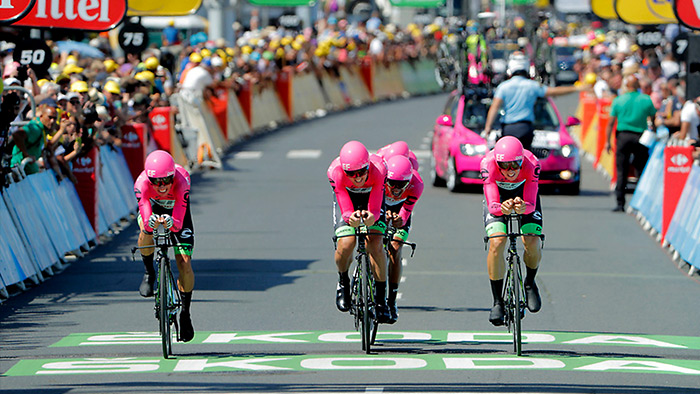
EF Education First- Drapac p/b Cannondale team captain Simon Clarke said this stage has been a target for his team since the Tour de France route was announced last year. But looking at Simon’s individual stats doesn’t really tell his (or the team’s) full story, so we must break them down to reflect the tactics of the day.
In a TTT, the official team finishing time is taken with the 4th rider to cross the line. It all comes down to getting those 4 riders, and the team GC leader (in this case Rigoberto Uran), to the finish line as fast as possible. To do this, the pacing and energy expenditure of specific riders at different points on the course was planned with tremendous detail.
It is obvious looking at Simon’s data that his job was to get the team off the blocks as fast as possible, with a peak 5 minute power for the day set within the first 4km. He rode that opening 5 minutes at an average power of 405w (6.43w/kg), and the effort continued over the opening 21.5km; Simon was one of the team’s driving forces in the early kilometers of the stage and well through the halfway point.
Stats for opening 21.5km
0:23:47
54.5kph
Average Power – 364w, 5.78 w/kg
Normalized average power – 388w, 6.16 w/kg
Ave Cad – 100rpm
The opening 21km was littered with small twists and turns, along with several roundabouts. but EF Education First-Drapac p/b Cannondale remained fluid, showing their ability to be totally cohesive as a team on such terrain.
If we look at some Peak Speeds, we can really appreciate the incredible pace of these teams. During the middle section of the stage, Simon’s team had a peak 5 minute AVERAGE speed of 61.5kph. He had an eye-watering max 5 second average speed of 90.4kph. His highest speed for the day was 91.3kph. When you consider the positioning of the group (riding barely 2cm from each others’ wheels) it is truly impressive to think of the skill and technique required to avoid disaster.
During the period in which Simon was with the team you can see that many of his turns at the front were very smooth, despite kicking his power up to 450-500w, 7.5w/kg approx. for the 20-30 second turns over the front.
It’s also worth noting that some of his short-term peak powers were done as the team accelerated out of the many corners. For example, his peak 5 second power took place exiting a roundabout after 13km of racing. Here he averaged 805w, 12.8w/kg with a max power of 906w, 14.38w/kg. I am confident that the ability to take these obstacles at speed and maintain a powerful exit was a decisive factor in many of the teams’ finishing times.
As you can see from this file, Simon’s job was done after 21.5km. Here he pulled the pin and let the team fight out the final 12km without him. Simon rode a steady tempo into finish, safe in the knowledge that he had made a major impact to the team’s final time. His huge effort in the first half of the stage was a major factor in what turned out to be a successful sixth-place finish for the team.
Rider Analysis: Mathew Hayman
Team Finish Position: 4th +9sec
Click HERE to view the file
As team captain and one the chosen riders to make the start as fast as possible for his team, Mathew Hayman is in a similar position to that of Simon Clarke. The Mitchelton-Scott GreenEdge team had an incredible ride, finishing only 9 seconds off the winners and earning 4th place on the stage. Like Simon, most of Mathew’s peak powers took place in the opening 18km. His peak 5 minute power began at the start ramp, and continued for the first 18km, going over 5w/kg for the opening 20 minutes of the race.
Peak Powers:
5min – 453w, 5.66w/kg
10min – 425w, 5.31w/kg
20min – 406w, 5.07w/kg
The long drag of around 2% leaving the start town of Cholet was the perfect opportunity for Mathew to use his big engine to power the team to a fast start. On this section of road, Mathew made his peak 2 minute power for the day at 579w, 7.15w/kg.
Although they were the first team off the start ramp, Mitchelton-Scott GreenEdge set some extremely fast opening splits which were only beaten by a small number of teams later in the stage—in fact they were faster than both Sky and BMC in this section.
Again, like Simon Clarke, Mathew had his final pull at the front with around 10km to go, before rolling in the final 10km section at a steady pace. Both teams pulled off an outstanding race on this crucial stage.


