
Endurance athletes are collecting more data than ever before, and as a result, it’s becoming more difficult to extract meaningful, actionable insights from that data. Any athlete with a power meter might be collecting upwards of 30,000 power samples a week and have an individual power curve of several hundred data points that updates every single day.
In the early days of power-based training, coaches and athletes came up with some useful shortcuts and mental models to understand and use that data. 20-minute power can be used to estimate threshold, five-minute power is a good indication of VO2max or maximum aerobic power, one-minute power is related to anaerobic ability, and five-second power tells you if an athlete is a good sprinter.
Limitations of Power-Based Training
These ideas were useful and moved the industry forward for almost 20 years, but they also have obvious limitations. What if an athlete is an elite track pursuit racer, so most of their important efforts are closer to four and a half minutes? What if their favorite climb to test their power only takes them 17 minutes? Why does five-second power receive so much focus when the majority of sprints in road and criterium racing take 12 seconds?
Additionally, threshold (whether measured in a lab with a lactate threshold test or in the field as FTP, or Functional Threshold Power) was one of the first things to be identified as a key indicator of performance and progress, and since 20-minute power is an easy and repeatable field test threshold, it became the default indicator for endurance training as a whole, as well as the basis for most intensity zones systems and therefore most workout planning.
Threshold is still arguably the most important factor in endurance performance since it is so strongly correlated with fitness across a broad range of aerobic intensities, but it isn’t as strongly correlated with performance in the other energy systems: anaerobic glycolysis (very hard efforts of 30 seconds to a few minutes in duration) and the phosphocreatine system (ATP-PCr, all-out sprints less than 30 seconds long.) As a result, threshold alone may not be a sufficient metric for tracking performance, identifying individual strengths and weaknesses, or planning optimized workouts, especially for disciplines that rely more heavily on anaerobic energy systems for success.
All of this together reveals a few main limitations in the current way we define performance, track progress, and plan workouts in endurance sports.
- Threshold alone doesn’t capture enough information about an athlete.
- Selecting other individual peak power values (one-minute, five-minute, etc) can be limiting or hard to consistently manage and monitor across a variety of different athletes and event types.
An improved system would:
- Consider an athlete’s entire power curve so that no information is missed.
- Extract concrete and reliable metrics related to each energy system so they can be individually assessed and targeted.
For the past few years, TrainingPeaks has been testing and developing a model to achieve this. The Power-Duration Curve (aka, PD curve) and metrics that have been used and refined by coaches and scientists in WKO have recently been added to TrainingPeaks as Modeled Power and Modeled Power metrics. This article will show what this model is based on, what those metrics are, and how coaches and athletes can interpret and utilize them.
What is Modeling?
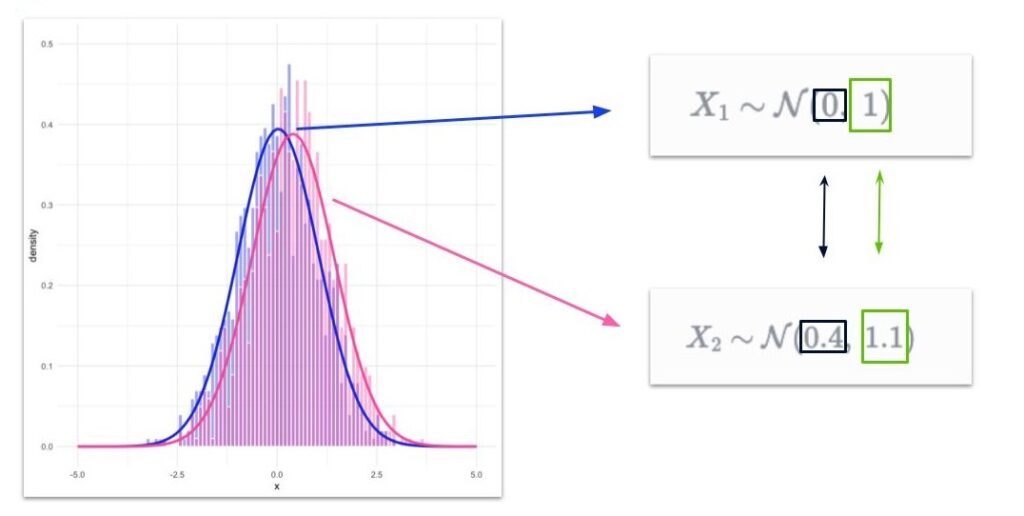
To understand how power and exercise intensity modeling work, it’s helpful to understand what modeling is more generally, using an example most people are already somewhat familiar with. Take these two data sets. Each one is 1,000 individual data points. You can imagine these represent almost any type of real-world quantitative data – the heights of people in two different countries, ratings of popular TV shows, performance improvements from gummy bears vs purpose-made training nutrition products, or Boston Marathon finish times. We might be interested in whether these data sets are actually different or more likely the same. As raw data, they are just two lists of 1,000 numbers, and we have no good way to learn anything about the groups that the data came from.
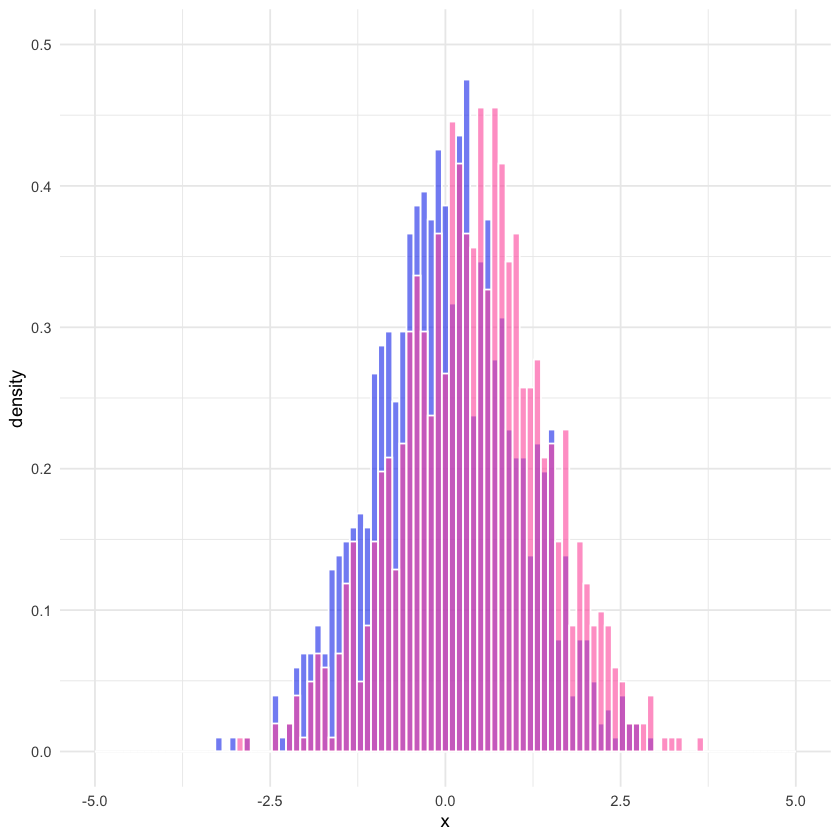
But we do have a good model to describe this data: the normal distribution, or better known as the bell curve. This is the equation for the normal distribution, which doesn’t seem that much easier to handle than the original raw data at first glance.
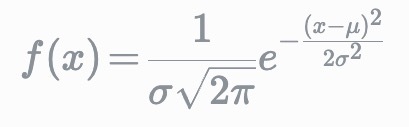
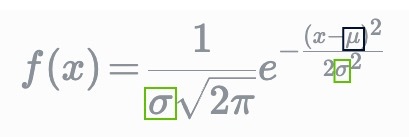
But it’s important to know that only two parts of this equation ever change. This means that every bell curve can be uniquely described by just two numbers.
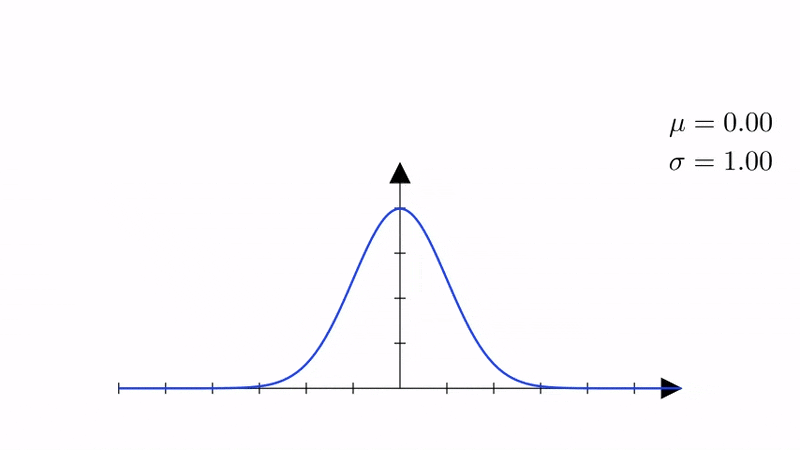
With this one simple step, we’ve gone from two sets of 1,000 data points each to two pairs of numbers. That model, the bell curve, is so well understood that we can easily derive insights from it regardless of what the data is or where it came from.
Statistics is just the recipe book for the math we do to known models like this. This is the power of modeling and is worth stating again.
Modeling lets us take large amounts of messy, incomplete, imperfect data from the real world and turn it into simple, well-understood mathematical objects that we can easily compare and manipulate.
If you’ve made it this far, you might be wondering what this has to do with coaching and training. You may have even become a coach specifically to avoid the need to think about math; don’t worry – we’re almost done with it.
Understanding Modeled Power
Modeling is useful in endurance training because some of the messiest, most incomplete, and most imperfect data around is the data collected by athletes. Coaches, athletes, and scientists have known for a long time that intensity-duration curves (in this case, power-duration curves) are a meaningful representation of an athlete’s current abilities, but until recently, there haven’t been reliable, easy-to-use models that can extract useful, easy-to-understand insights from that data. The earliest attempts to model the relationship between intensity and duration date back nearly a hundred years to Nobel Prize winner A.V. Hill. Since then, some of the more well-known names in exercise science — Sir Roger Bannister, Monod and Scherrer, Francois Peronnet and Guy Thibault, Phil Skiba, Andy Coggan, and countless other scientists and coaches — have continued to develop and refine the model into something we can use today. There are still a few variations of this model, but they all take the general form below.
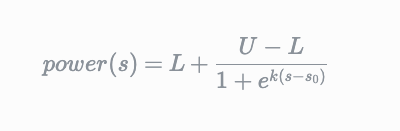
Which also looks daunting until we rewrite it in terms that explain what each variable means.

Then we can see how those three parameters — sprint ability, threshold (in watts), and anaerobic capacity (in kilojoules) — can be adjusted to create a modeled power curve that matches any given athlete’s real-world power curve data.

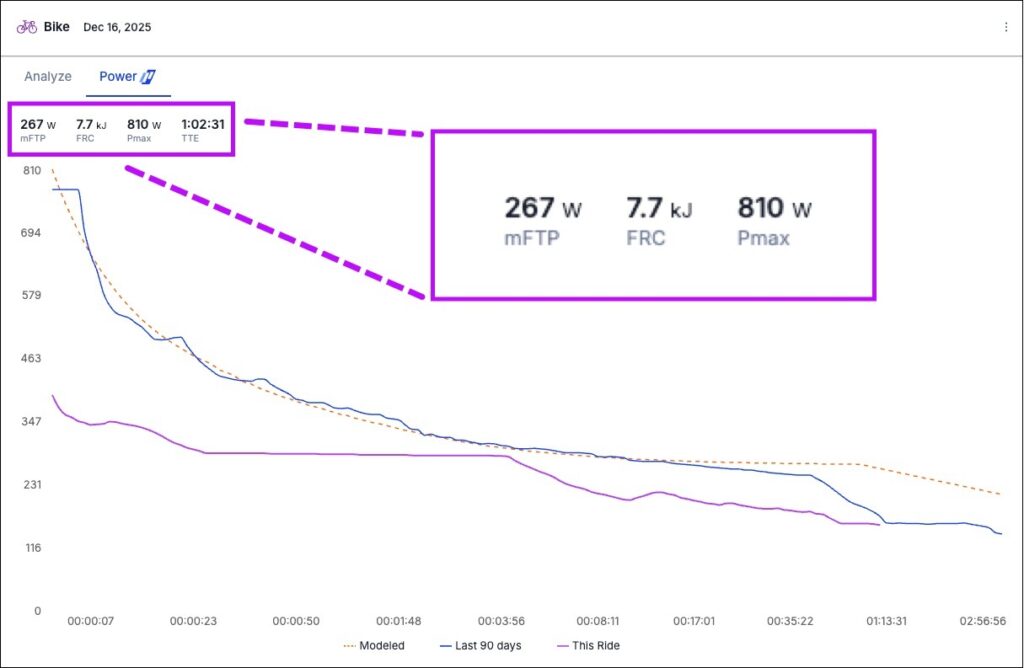
The result is a set of three numbers derived from an athlete’s recent (usually the past 90 days) power data that quantify their ability across each energy system.
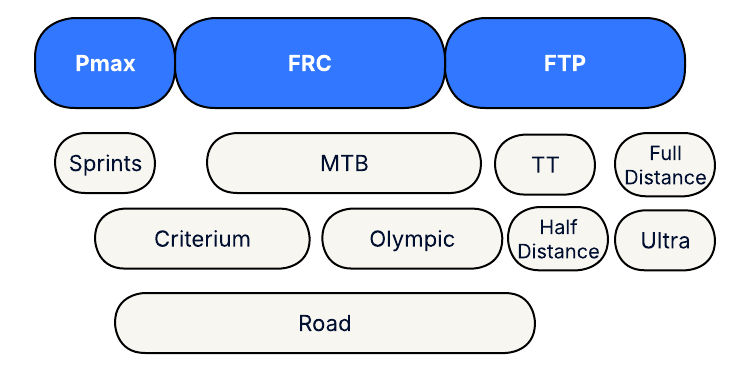
- Pmax represents an athlete’s sprinting ability. This is expressed as a maximum sprint power but is affected by improvements across all sprinting durations. In other words, Pmax will increase if an athlete sets a new best 5-second power, or if they sustain their current 5-second power for longer and set a new 10-15 second best instead.
- mFTP is modeled FTP. This can be interpreted the same way as FTP or other threshold tests. The benefit is that it reduces the need for specific, structured testing, as all new data contributes to mFTP. If an athlete sets a new peak power for 47 minutes and 11 seconds in a race or a new 18:03 best chasing a KOM, their mFTP will update. It also removes negative consequences of determining threshold from a single data point like peak 20-minute power. Some athletes have high anaerobic energy contribution to 20-minute power tests (or have trained themselves to be especially good at 20-minute tests over the years), so those tests overestimate their FTP and require customized adjustment factors.
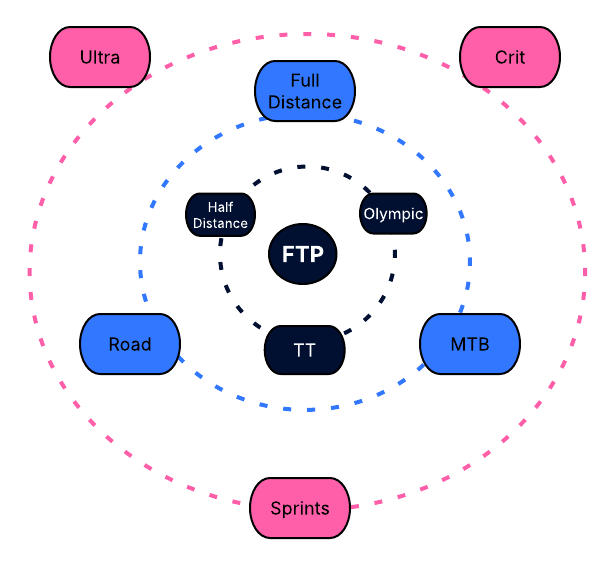
- FRC is Functional Reserve Capacity. This relates to the amount of work an athlete can do above their threshold continuously before needing to reduce intensity back to below mFTP. FRC spans the critical duration range from about one minute to around eight minutes at anaerobic and maximum aerobic intensities. Efforts related to FRC include:
- a road racer’s ability to attack and break away or chase down an attack
- a mountain biker’s ability to tackle short, punchy climbs
- a cyclocross racer’s chances at starting hard and getting a good position in the first lap
- a triathlete’s potential to raise their threshold before it starts hitting their maximum aerobic “ceiling”
Interpreting and Applying the Modeled Power Metrics
How can coaches and athletes use these metrics? Since all of these metrics are related to a specific ability or performance factor, the simplest interpretation is that if any of them go up, that’s a good thing, especially if that athlete’s goal event or specific race limiter is dependent on the corresponding energy system. If a full-distance focused triathlete sees an improvement in Pmax, that’s a good sign of well-rounded training, but they may not see much of an improvement in their results. Similarly, a road racer may spend all winter on the trainer raising their mFTP but get dropped during the first surge in the first race of the season if their FRC is low.
At a more advanced level, coaches and athletes can begin to see how some metrics may decline in response to certain types of training, while others improve. The single lever of “increase threshold to improve performance” has now become a set of three dials that can be tuned and tracked for more individualized training.
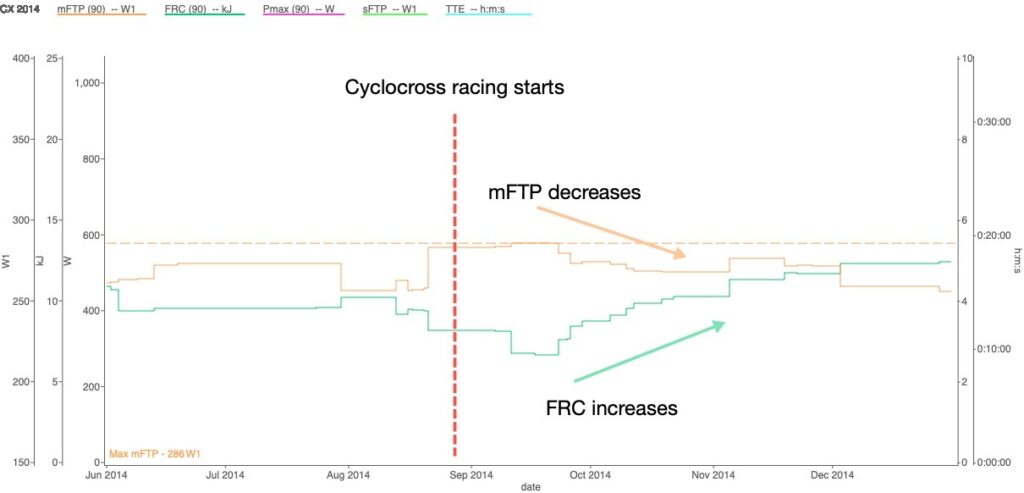
Below is a simple example of mFTP and FRC over time from the summer pre-season build through the full cyclocross season. Prior to the start of the season, this athlete’s training focused on developing their aerobic base and threshold as much as possible, and once the season started, their training shifted to more specifically targeting maximum aerobic and anaerobic power. As a result, their mFTP actually decreased during the season, but their FRC continued to rise and their results continued to improve. Prior to the availability of FRC tracking, the only well-known performance metric was FTP, and seeing that decline during the most important time of year may have unnecessarily created doubt or panic in the athlete or their coach.
Each of the modeled power metrics is related to an aspect of training and performance that coaches and athletes are already familiar with, but it can still be overwhelming to get started with using them. Here are some tips to get started and integrate them into your training and coaching practice.
- Look at past data. Look for previous experiences that might be explained by or correlated to changes in the modeled power metrics. Did you have vastly different performances in two similar races, even though your FTP and race-day execution were the same? Go back and see if your FRC was much different. Did you feel much stronger in group rides after a hard intensity block, even though your 20-minute power went down? Look for changes in Pmax or FRC.
- Compare your own data over time (or different athletes’ data to each other if you are a coach) to get a sense of reasonable ranges for each of the metrics and how they are correlated with different performance levels. As these metrics become more widely used, standard ranges will be published, similar to threshold power-to-weight ratio tables that have been available since the early days of power meters.
- Pay attention to how the modeled power metrics for you and your athletes today change in response to specific types of training. Once you understand those patterns and how to manipulate those variables, you can take the next step from using the metrics as analysis tools to understand the past to manipulating them with individualized training that targets specific athlete limiters.
Power-based training has been evolving from its inception. Just as functional threshold field testing has overtaken lab testing, modeled power metrics are now refining our understanding of the overall relationship between intensity and duration and of athletes’ strengths and weaknesses. By distilling thousands of data points through a well-founded physiological model, we can move beyond relying on single data points to a more complete, more individualized, and more effective way to improve performance.

")


")

