
When triathlon race season is just getting underway, it’s time for your training to prepare you for the demands of race day. This phase of triathlon training is often referred to as the build phase, as your key sessions will become specific to race-day actions.
How you train during this period, therefore, depends on the specifics of your upcoming race. Short-course athletes will focus on efforts at or near threshold, while long-course athletes will find themselves logging more endurance work. This article, however, isn’t about how to train for your race — we’re going to take a deep dive into which metrics you should be tracking in TrainingPeaks to ensure you are on track for your best race day, no matter what your event is.
CTL (Chronic Training Load)
To get a sense of how your overall fitness is progressing, let’s take a look at chronic training load or CTL. Also known as “Fitness” in the TrainingPeaks app, CTL is an exponentially weighted average of your Training Stress Score (TSS) from the past 6 weeks, taking into account how much you have trained in both duration and intensity. This rolling average gives you a long-term view of how your training is progressing. If your CTL is increasing, then your fitness is likely increasing, too.
In order to ensure your fitness is progressing at a rate that will have you prepared for your target race, you’ll need to identify your target CTL. Talk to your coach about an appropriate target or, if you’re self-coached, here is an article that outlines CTL ranges for the various triathlon distances, from sprint to IRONMAN. The ranges in this article are broad and the high end is very high, so shoot for a CTL that is appropriate to your experience, goals, and available time. Your goal is to hit your target CTL right before you begin your taper.
Ramp Rate
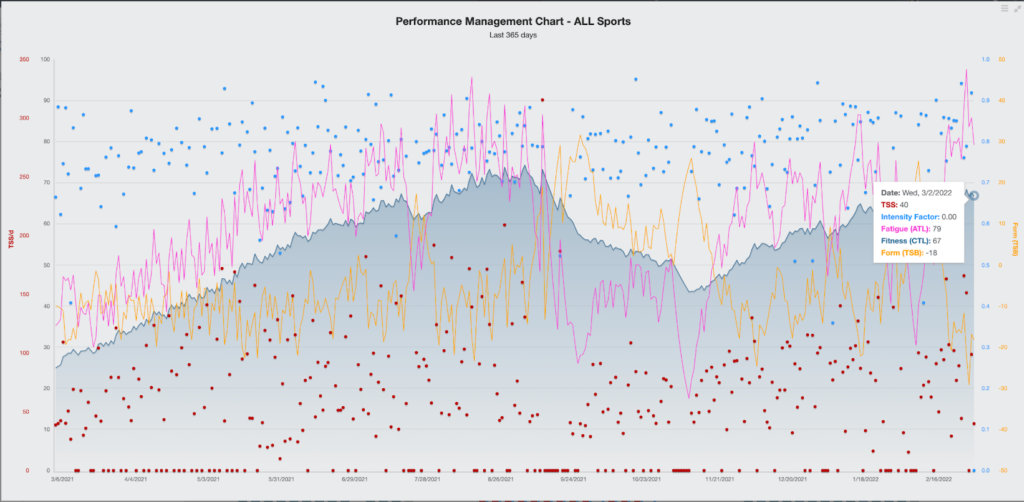
Once you have this target, you’ll need to identify a safe rate at which your CTL should rise over time in order to achieve your target CTL. This is called ramp rate — the rate at which your TSS increases or decreases over time — giving you a sense of whether your fitness is rising (indicated by a positive ramp rate) or declining (indicated by a negative ramp rate). You can view your ramp rate using the Performance Management Chart in your TrainingPeaks app.
As mentioned, it’s important to identify a safe ramp rate so that you’re not pushing your fitness too quickly, which could lead to injury, among other things. A safe 7-day ramp rate will reflect an increase in CTL of about 4 to 8 points. The higher your current CTL, the higher the ramp rate you can likely tolerate. However, always let your body be the ultimate guide! Excessive fatigue, inability to recover, or lingering soreness (beyond two days) may all be signs that you are building too fast. For most athletes, a ramp rate higher than 8 often leads to injury, illness, or burnout — but there is wiggle room.
Consider the following general guidelines of target weekly ramp rates to keep track of as you go:
| Current CTL | Low-Risk Ramp Rate | Moderate-Risk Ramp Rate | High-Risk Ramp Rate |
| 45 or less | 3 or less | 4-6 | 7 or more |
| 45-70 | 4 or less | 6-7 | 8 or more |
| 70 or more | 5 or less | 6-8 | 9 or more |
You can track the rise and fall of your CTL on your TrainingPeaks Performance Management Chart (PMC). Hover over the CTL line to see past, present, and projected future CTL. You will also find your current CTL in the TrainingPeaks mobile app and on the home screen in the desktop version. Remember that in TrainingPeaks, CTL is the same as “Fitness”.
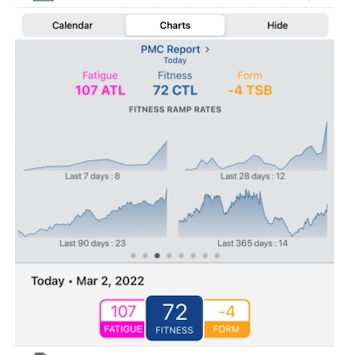
You can find your ramp rate in the home tab on your desktop or on the fitness report in your mobile app, where it is calculated for the previous 7, 28, 90, and 365 days. A positive number represents growth in TSS or CTL. In the image below, this athlete has a ramp rate of 8 in the past 7 days, which represents an increase from their 28-, 90-, and 365-day averages. As such, their training load has ramped up as the athlete enters the build phase.
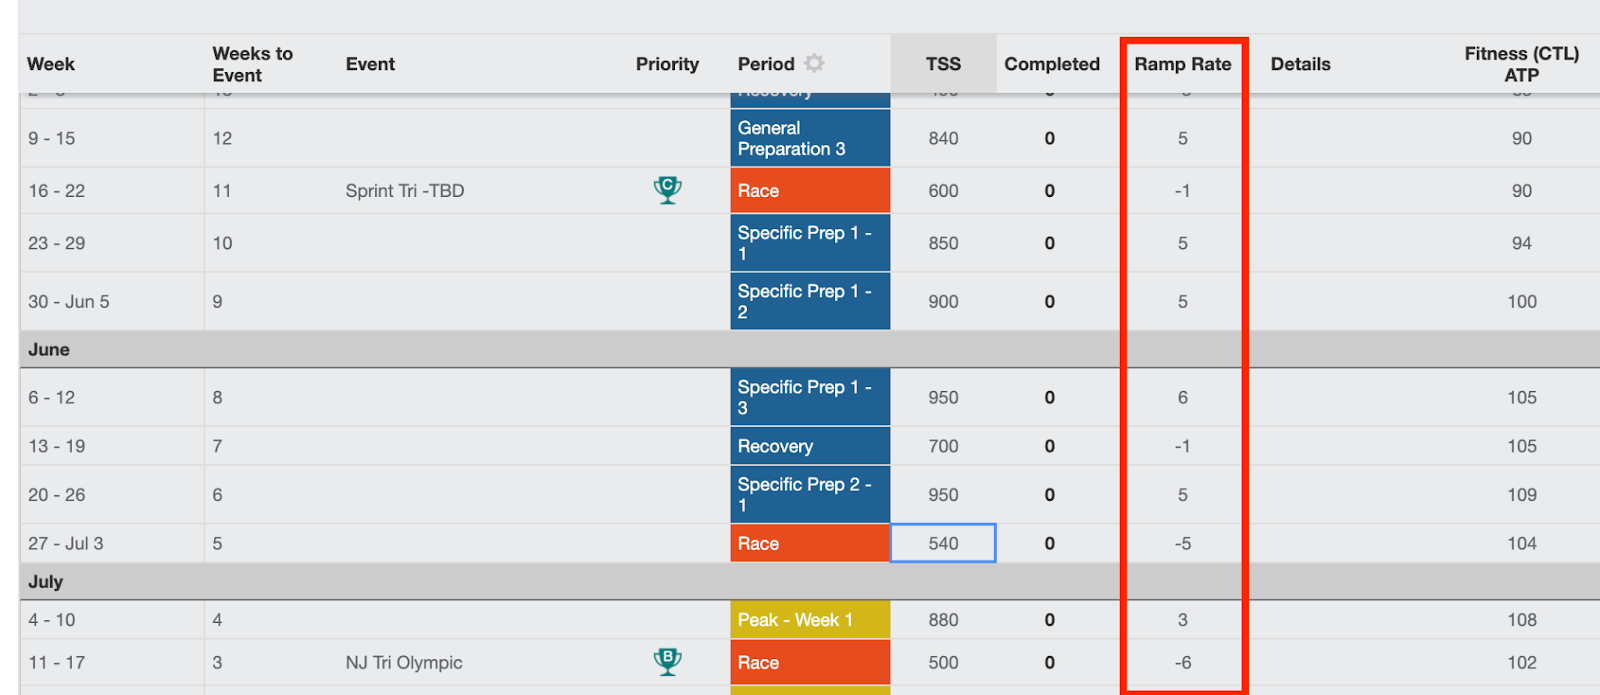
Additionally, the TrainingPeaks Annual Training Plan feature will provide an estimate of your ramp rate based on the projected weekly TSS. This tool can help you plan your training load (using TSS) and ensure you are on track to hit your desired CTL by the end of your build. Remember that for these metrics to be accurate, you must set accurate thresholds for each sport.
I am working with an athlete targeting a CTL of 100 in time for a July race. With a conservative ramp rate, they are projected to be just above this before the taper. As a busy working professional, providing a bit of cushion helps for those times when life just happens.
TSS (Training Stress Score)
Now that we addressed the CTL metric for overall training load, let’s dive into specific workout metrics like Training Stress Score. Known as TSS, Training Stress Score quantifies the training stress of a particular workout based on duration and intensity, which can help you plan race-specific workouts that generate a load that is similar to what you’ll experience on race day.
Below are some general ranges for the TSS an athlete may need to generate for each race distance, from sprint to IRONMAN. As with CTL, these are broad ranges, so adapt to your experience and goals.
- Sprint: 75-120 TSS
- Olympic: 170-220 TSS
- Half IRONMAN (70.3): 300-400 TSS
- IRONMAN (140.6): 590-750 TSS
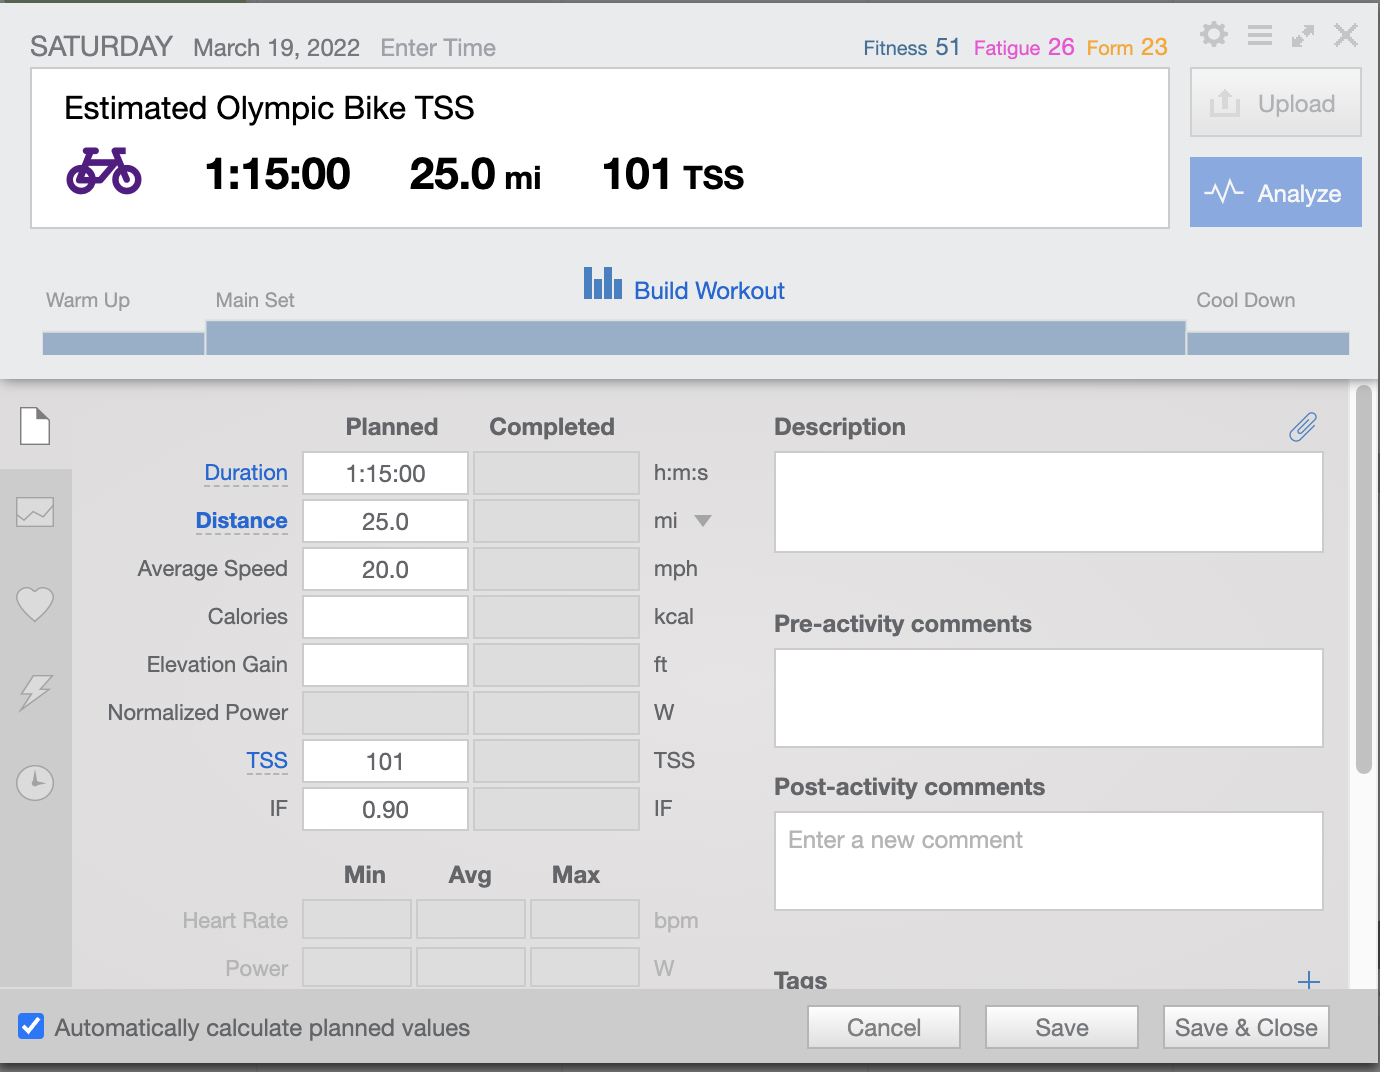
To help estimate TSS for race day, create a new workout in TrainingPeaks. Enter the duration and your estimated Intensity Factor (IF) for the race. This will automatically calculate an estimated TSS, as long as you have the “automatically calculate planned values” box checked (see lower left-hand corner of the image below).
Using this estimated TSS, you can create workouts that approximate that number, but with a few caveats:
- For long-course racing, limit how many big TSS days you have, especially for the run. These big days require a lot of recovery and can impact overall consistency, which is the most critical part of training. I will always put my money on the consistent athlete over the athlete who only does the big days. How many of these days you can tolerate will depend on how well you recover after these sessions. Generally speaking, I don’t recommend exceeding a -30 Training Stress Balance (aka, TSB or “Form”). And pay attention to how you feel once you hit -20, as you may need to pull back sooner than -30.
- Short-course athletes can more safely hit this TSS estimate without falling off the cliff. However, this isn’t a blank check to train race day TSS every day — give your body time to recover after these race-specific days! Without recovery, your body won’t adapt; and without adaptation, you won’t perform.
In addition to single-day TSS, keep track of weekly TSS. Gradually increase your weekly TSS using the ramp rate guidelines previously mentioned. You’ve likely heard the general rule to add no more than 10% at a time; however, this depends on fitness and experience. Some athletes can tolerate more, some less. In this regard, your CTL, TSB, and 7-day ramp rate can help you personalize your unique needs.
Peaks
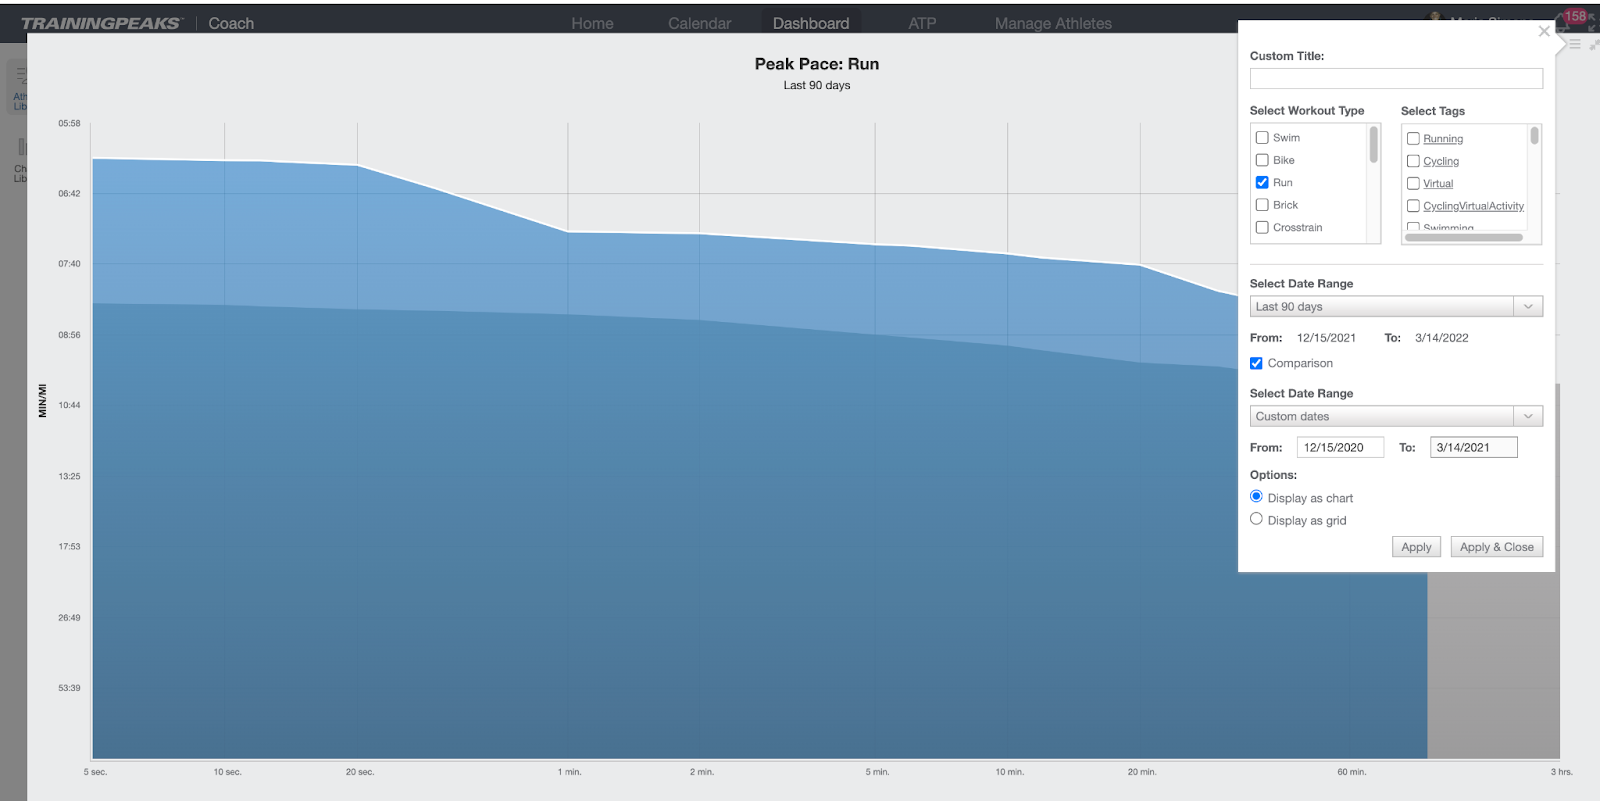
Tracking pace and power peaks can be useful in charting growth across weekly training cycles as you get closer to race day. As these peaks grow, you can be assured that your training is creating adaptations that are making you stronger or faster — and likely a combination of both.
Your chart options for tracking peaks include the Fitness History chart, Peak Pace or Peak Power charts, and Peak Performance history. You can add these charts to your TrainingPeaks dashboard, where they can be customized by sport (swim, bike, run) and by metric (pace, power, heart rate).
Depending on your distance, you may be focusing on different peak durations, which we’ll discuss next.


Sprint or Olympic Peaks
Athletes racing sprint or Olympic distances can monitor 5-, 10- and 20-minute peaks in pace and power to give you a good sense of your efforts at VO2 max through threshold. Ideally, you want to see power and pace improve for these durations. The 20-minute peak can especially help you dial in a race effort.
70.3 or 140.6 Peaks
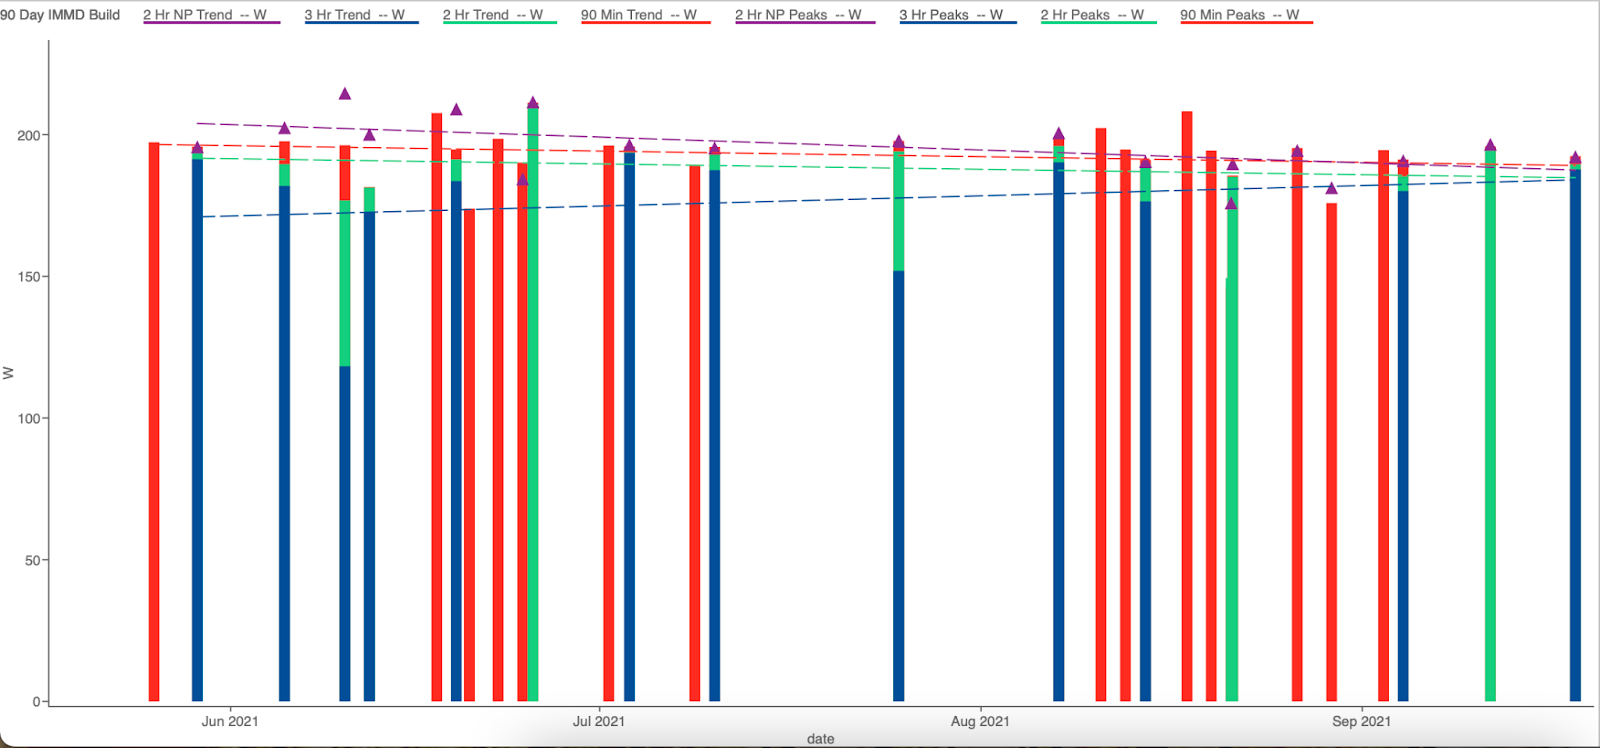
Long-course athletes racing half or full IRONMAN distances can monitor 60-minute through 3-hour peaks. These endurance-focused peaks can be found in your Peak Performances chart. You can also monitor them using WKO5 with the Endurance MMP Peaks chart. The chart below tracks the performance of an athlete preparing for 140.6 in September. As you can see, their 3-hour peak gradually rises on the way to race day (navy blue line). This is ideal for a long-course athlete.
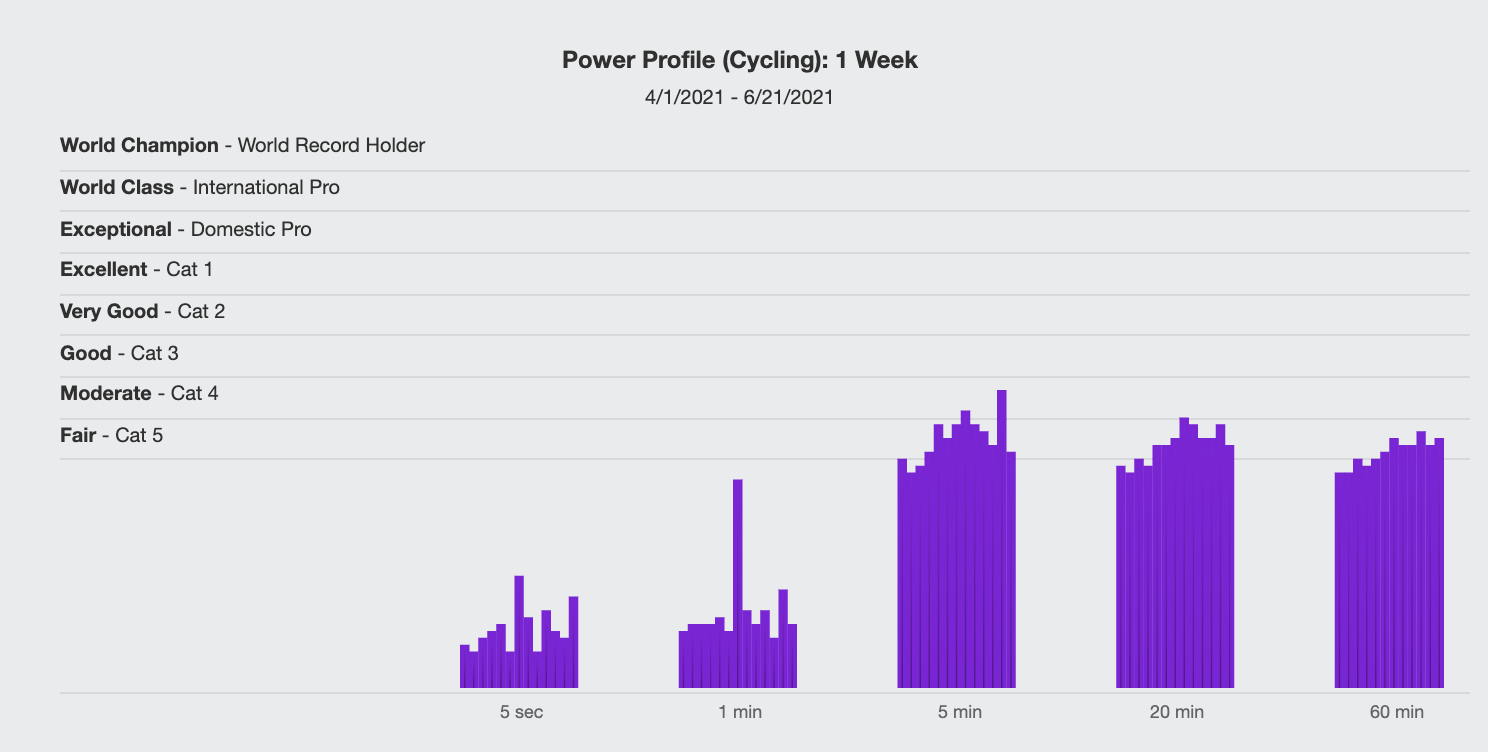
If you want a competitive comparison, the cycling Power Profile chart (available in the TrainingPeaks dashboard) helps you gauge where your watts/kilogram sit with respect to riders ranked Cat. 5 through World Champion. Your current weight is required for accuracy.
Pacing
Race-specific workouts provide insights into how to properly pace your upcoming race. Analyze your heart rate, power, and pace (when applicable), and match those metrics with your RPE or Rating of Perceived Exertion. Did the effort feel sustainable, were you gassed, or did you have more in the tank?
Consider the trends for these workouts, as well as how even your effort was. Take note of your fueling and hydration in your post-activity comments so you can determine what intake was effective and what wasn’t.
This information will help you develop a race day pacing program. Use all available metrics so that you are empowered to make race-day decisions about your effort. Different conditions can impact the numbers, so understanding how race effort should feel is key to your success.
Check Your Progress
Use all of these metrics to check your progress regularly throughout the build period. Are you on track to hit your target CTL? Do your Fitness History charts show improvement? In addition to these trends, compare similar workouts for growth in pace/power, Efficiency Factor, Variability Index, and Rating of Perceived Exertion.
This information will assist you in properly executing training and in preparing your race strategy. For example, as I’ve written previously, a lower heart rate for the same pace/power and RPE may signal to you that it is time to update your thresholds — thus keeping your training on track.
For these reasons, I recommend regular reviews of your metrics — at least once a week — to determine if you are on track for your race day success!


