
In our books The Secret Of Running (www.thesecretofrunning.com) and The Secret Of Cycling (www.thesecretofcycling.com) we have described our unified theory for the performance in running and cycling. Our running model is based on the premise that the power produced by the “human engine” (i.e. the leg muscles and the heart-lung system) must be equal to the sum of the power required to surmount the running resistance Pr, the air-resistance Pa and the climbing resistance Pc, as indicated in the figure below.
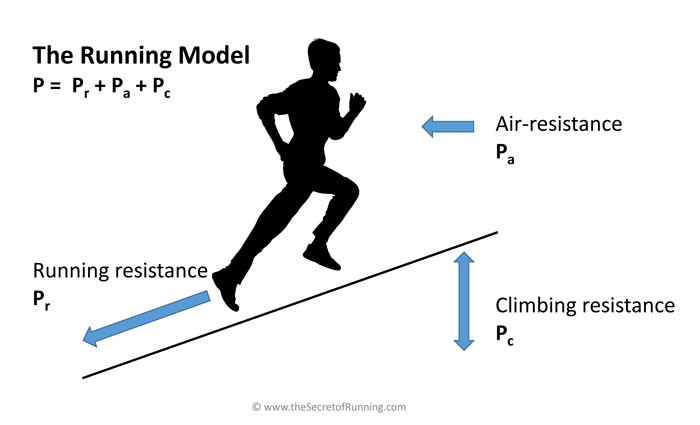
This means that in practice a runner is slowed down by the air-resistance and—in case of hills—the climbing resistance. We have modeled Pr, Pa and Pc, using the laws of physics and in analogy to similar models used in cycling.
Next, we have modeled the power of the human engine P, using the laws of physiology. The result is a complete model which enables us to calculate the speed of a runner, depending on his running power and running economy and on the environmental conditions (wind, temperature, altitude, air-pressure, hills, footing).
In this paper, we will briefly describe the model and some interesting results. Meanwhile, we have tested the model in many situations (running, cycling and both in the lab and in races) and found the results very convincing and consistent. Finally, we have observed that the Stryd power data match our model calculations perfectly.
The physics of running
We have applied the laws of physics to running and derived the equations, presented in the box:
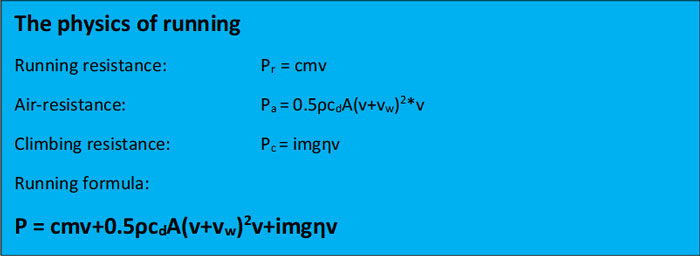
As an example we use a c-value (the running economy or Energy Cost of Running) of 0.98 kJ/kg/km, a body weight m of 70 kg and a speed v of 20 km/h. Pr then becomes 0.98*70*20/3.6 = 381 Watts. We can compare this to the air-resistance with the example of an air density ρ of 1.205 kg/m3 (which is the case at sea level at a temperature of 20 °C and an air-pressure of 1,013 mbar), an air-resistance coefficient cdA of 0.24 m2 (we have derived this number from literature), windless weather (so vw = 0) and the same speed of 20 km/h. Pa then becomes 0.5*1.205*0.24*(20/3.6)3 = 25 Watts.
This means that even at a level course (so Pc = 0), and in windless weather, some 7 percent of the power of the runner is lost due to the air-resistance. In record attempts pacers are frequently used to shield the elite runners and reduce the air-resistance (by some 20 percent). We have used our model to calculate how big the advantage of pacers is for world record performances.
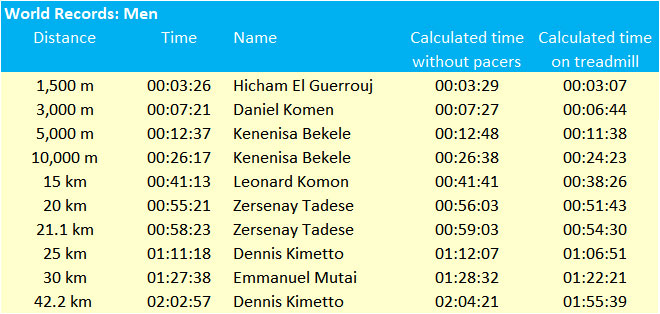
According to our calculations, Kenenisa Bekele owes some 21 seconds of his phenomenal 10,000 m world record to the reduced air-resistance from his pacers. The air-resistance is eliminated altogether on a treadmill, so in theory Kenenisa Bekele could run even two minutes faster at the 10,000 m on a treadmill! The table below shows the present world records and the results of our calculations without pacers (so with increased air-resistance) and on a treadmill (so without any air-resistance).
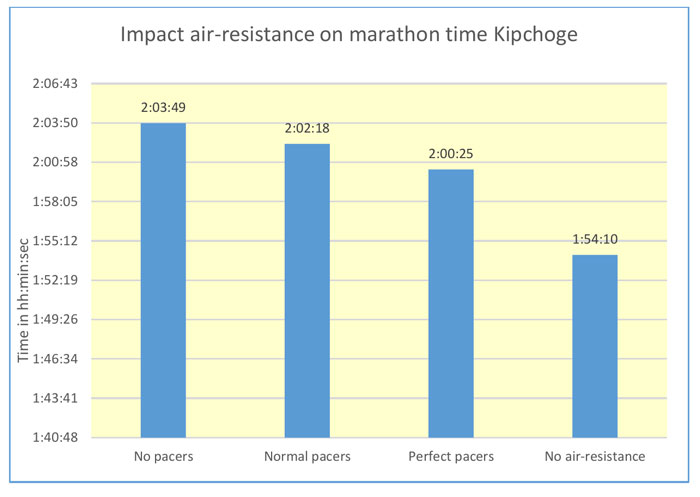
The recent sub-two-hour marathon attempt of Eliud Kipchoge confirmed the importance of reducing the air-resistance. We have calculated that the reduction in air-resistance during this attempt (by the combination of the rotating group of pacers and the wind-breaking time screen on the car) was virtually perfect at 37.5 percent. According to our calculations, his 2:00:25 is equivalent to 2:02:18 in a normal race (which would be still an impressive new world record).
Another example of the power of our model calculations is presented in the figure below. Here, we have calculated the impact of the air-resistance on the 100m world record of Usain Bolt. We found that his Berlin world record of 9.58 is equivalent to 9.36 at the altitude of Mexico City (where the air-pressure is much lower). Theoretically, Usain might have run even 9.18 seconds when all factors would have been ideal (altitude, temperature, tail wind of 2 m/s)!
The physiology of running
We have applied the laws of physiology to running and derived the table below that specifies the power limits of the four power producing processes in the human muscles. We consider these numbers as the maximum of human power for male elite athletes (who have very little body fat, for women the numbers are some 11 percent lower due to their higher fat percentage).
They are based on the fundamental biochemistry of the conversion processes (i.e. the maximum conversion speed and the energy production per unit of time) and on a gross metabolic efficiency of 25 percent (i.e. 25 percent of the metabolic energy is transferred into mechanical work, this number is considered the maximum for elite athletes in running and cycling).
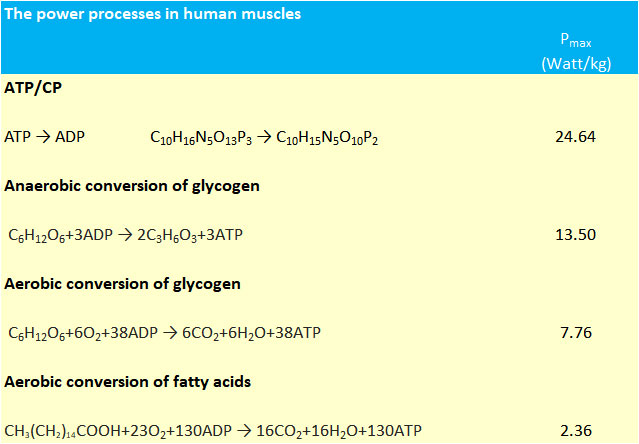
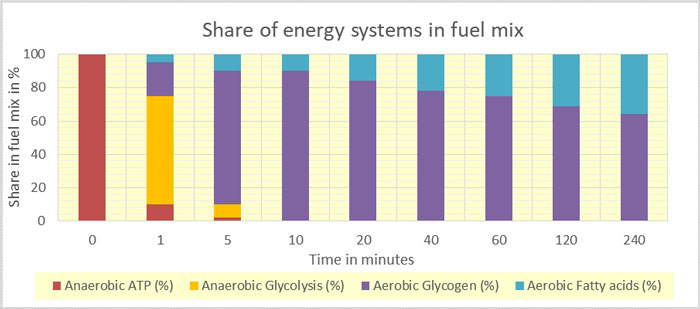
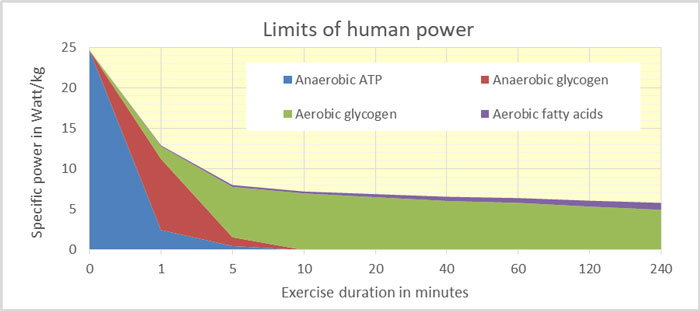
Next, we have analyzed the impact of endurance time on the “fuel mix” in the muscles and the power produced. Sprinters use mainly ATP, 400 – 800 m runners use mainly the anaerobic conversion of glycogen, but distance runners rely on the aerobic conversion of glycogen and fatty acids.
This means that as distance/endurance time increases, less power can be produced so the speed is reduced. We have proven that this shift in the fuel mix is the cause of the well-known “Riegel’s formula” which describes the reduction in speed with distance and endurance time. The figure below shows our results for the fuel mix at various endurance times:
Running power and FTP of the world records
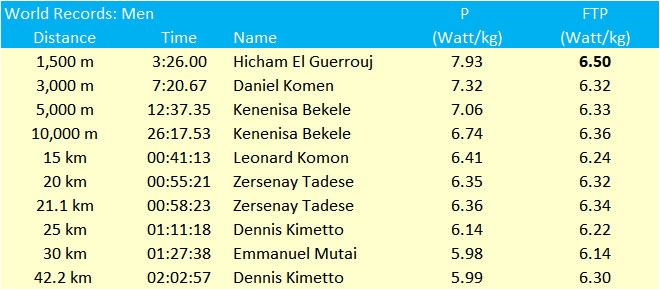
We have used our model to calculate the running power P to run at the speed of the world records. The table below confirms that at increasing distance and endurance time the running power P is reduced.
The table also shows the so-called Functional Threshold Power (FTP), which is defined as the power that can be maintained during one hour. We have recalculated P to FTP using Riegel’s formula as explained above.
The table clearly shows that most world records are equivalent to an FTP of around 6.35 Watts/kg. The FTPs at the records at 15, 25 and 30K are a little lower, which is probably due to the fact that these distances are run much less frequent. The FTP at the record at the 1,500 m is significantly higher, which is explained by the fact that the anaerobic processes play a more significant role here.
The limits of human power
From the biochemical data we have derived the limits of human power at various endurance times, see the table and figure below:
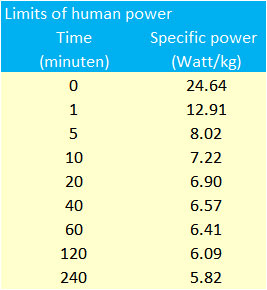
The table shows that the biochemical limit of the power that can be maintained for one hour (defined as the FTP) is 6.41 Watts/kg. This is quite close to the equivalent FTP of 6.35 Watts/kg of the world records in distance running that we noted above.
Meanwhile, we have applied our unified model to many elite performances in many sports (running, cycling, ice-speed skating) and we have consistently found an FTP of around 6.35 Watt/kg to represent the upper limit of human performance. The only time that we got higher values were for the performances of EPO-doped cyclists.
Conclusions and outlook
We have derived a new and unified theory on running, based on the laws of physics and physiology.
Our running model can be used to calculate the speed of a runner as a function of his running power (P in Watts/kg), running economy (ECOR in kJ/kg/km) and the environmental conditions (wind, temperature, hills, air-pressure, altitude, footing). The model can also be used to analyze the limit of human performances and we found remarkable similar values of the FTP across various sports.
Meanwhile, the first running powermeters have come on the market. We have tested the Stryd footpod, both in the lab and in the field and found that the results match our model calculations perfectly.
Obviously, these powermeters provide runners now with the means to optimize their training and racing. For the first time, runners now have—on a daily basis—the numbers to try to improve their running power P and running economy ECOR and to use their running power optimally, so constantly throughout the race.
We realize that this will not be easy because for us (and for most people) running has been habituated over many years. We will not be able to change our running habits and running form overnight. But with time and concrete data, we are confident we will be able to get better.
We hope that many readers will join us in this effort. Let’s share our data and conclusions on how we can improve our running! We are curious to the reactions and experiences of the readers, we welcome you to share these at www.thesecretofrunning.com.
Thank you to the co-author Ron van Megen
