
A proper season review is the best way to identify your strengths and weaknesses and develop a comprehensive plan for the upcoming season. With the availability of powerful data, and dynamic tools to analyze that data, reviewing your season is easier than ever. However, it’s also critical to the review process to know what metrics to focus on, allowing you to make informed decisions regarding your training. Having the right tools and knowhow make for a successful season review and sets you up for success when it comes time to start training again.
Top Three Broad Overview Strategies
Begin your overview by analyzing charts that allow you to get a bird’s eye view of your season. When you utilize this strategy you can pick up on long term trends and changes that took place over multiple training periods. When you start big it also lets you identify key areas and races that you can then hone in on at the workout level. Here are 3 high-level charts in WKO4 to help you determine what went well this season and where you have room to improve.
1. Performance Management Chart
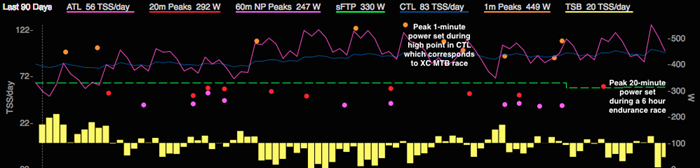
The Performance Management Chart (PMC) is one of the best places to begin. If you haven’t already done so, start by segmenting the PMC into custom date ranges that correlate to key periods during your season. These could be key events, the build-up to races, recovery periods, critical training blocks, etc. Once you’ve created your custom date ranges you can begin to dig a little deeper. This is a good place to look at core metrics like CTL, ATL, and TSB. Were you able to hit your desired CTL? Was your TSB (form) appropriate for priority races? How quickly were you able to recover? Knowing the answers to these and other questions can help you develop a better plan for next year.
If you’re using the PMC in WKO4 you can also view 60, 20, and 10-minute peak powers. The hope is that these peak power numbers were reached during races or maybe even key workouts. Taking it a step further to identify exactly when during a race or workout these peaks were reached, and on what type of terrain, can provide insights that are applicable to a solid race day strategy.
2. Power Duration Curve
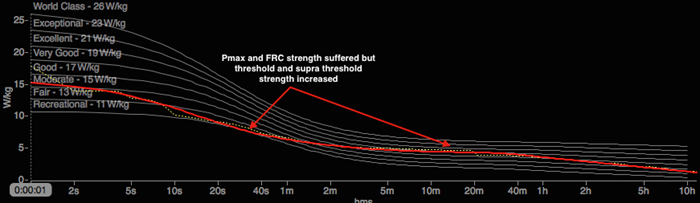
Many of the metrics that we rely on to analyze race performance and build progressive training periods are based on the Power Duration Curve. Understanding, reviewing, and using the PD Model is vital to be able to effectively use the metrics that we have at our disposal. Much like the PMC it’s helpful to review different time periods when using the curve. In the build-up to a criterium or cyclocross race you may have been focused on sprint power, but how did that impact the rest of the curve? Conversely if you’re preparing for a time trial your steady state power may have increased, while your PMax and FRC (Functional Reserve Capacity) may have suffered.
It’s acceptable for the curve to change as you prepare for different events, but understanding what happens when you focus on a specific area can help to develop a more comprehensive approach to your training. In the chart below we see an athlete’s build up to a 6-hour mountain bike race. The focus was on Stamina and increased FTP so the left side of the curve was diminished.
3. Time to Exhaustion
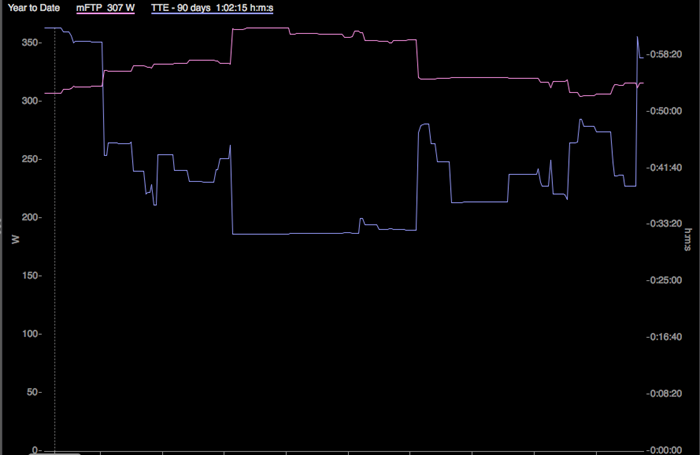
A relatively new, but extremely insightful metric in WKO4 is Time to Exhaustion (TTE). TTE is the maximum duration for which power equal to mFTP (modeled functional threshold power) can be sustained. This metric provides a snapshot of an athlete’s resistance to fatigue for threshold level efforts. By analyzing mFTP and TTE over time, and comparing them against one another, you’re able to see how different types of training and races impact both metrics. TTE puts mFTP into perspective as it relates to other key metrics. If you’re an endurance athlete then your goal may be to not only increase your FTP, but how long you can sustain that power. Race day pacing can also benefit as you begin to develop strategies for priority races. Whether it’s a pivotal climb on a racecourse or the ability to cover a breakaway, knowing your TTE allows you to be prepared for threshold and supra-threshold level efforts.
The chart below shows a varied race season with criteriums, road races, XC mountain bike races, and 100-mile mountain bike events mixed in. mFTP and TTE are in constant flux as the athlete prepares for and recovers from these different events. Using this in conjunction with the PD Curve and PMC help to paint a well-rounded picture, and allow us to make decisions about how to approach next season.
Top Three Workout Level Strategies
Now that you’ve identified key date ranges, races, and workouts it’s time to analyze the data on a more granular level. Getting the broad overview is great for picking up on macro trends, but the workout analyses is where you can really dig in and discover transformative insights. Here are 3 workout-level charts to help you identify your strengths and weakness during key races and training sessions.
1. Visual Matches
A go-to chart for dissecting race day performance should be the Visual Matches chart. Every athlete has a set number of “matches” in their matchbook, and no one has the same number of matches. A match can be defined as 20% over FTP for 1 minute. It may also be a longer duration at a lower percentage over threshold. The goal is to find out how many matches you have. Usually the time when you burn the most matches is during a race. Whether it’s a climb, a surge, a breakaway, or any other hard effort, you’re going all out more often than during training.
The Visual Matches chart shows your matches as red spikes in the power graph. By examining when and how you burnt your matches you can have a better idea of how many you have in your matchbook. They’re in short supply so using them wisely is key for race day performance and strategy. This chart illustrates an XC MTB race. You can see several matches were burnt at the beginning of the race to get the holeshot. Based on previous evaluation we knew that this athlete had the matches to burn early on to secure a first place position.

2. CX & MTB Review Pack
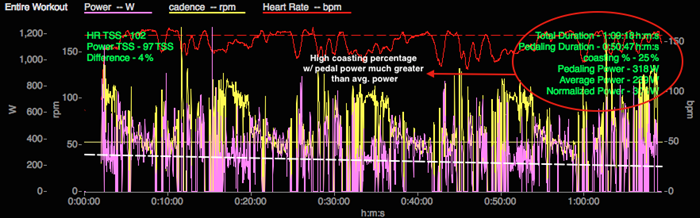
This chart pack was originally developed to analyze races that involve numerous pace changes and surges often found in cyclocross and MTB events. However, there’s value in this chart for racers of all disciplines. A few data points to focus on are total duration vs. pedal duration, Power TSS vs. HR TSS, and pedal power vs. average power. Total duration and pedal duration give a percentage of the time that the athlete was coasting. If the percentage is too high, or there was coasting during opportunities to pedal, then the outcome of the race could have been different. Heart rate TSS compared to TSS derived from power can shed some light on how your body responds to high output efforts and different race scenarios. Lastly pedaling power, the average power when force was being applied to the pedals, compared to average and NP powers give a more detailed look at the actual effort that the athlete gave when they were pedaling.
The example below shows a three-lap criterium with a substantial descent at the end of each lap. The coasting and pedal metrics help to tell a fuller story than if the file was reviewed without them.
3. Interval Review Pack
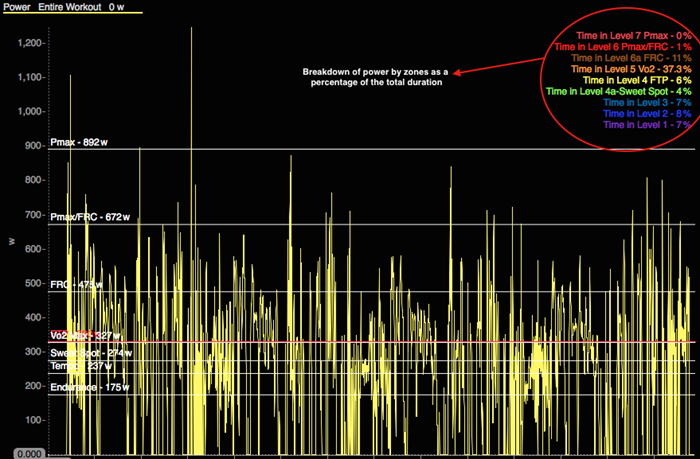
To look specifically at what systems were at work and the time spent above threshold during a race or a workout use the interval review pack. This simple and straightforward chart helps to quickly and easily highlight power zones and trends during the ride. This chart is particularly helpful when developing a training strategy for the coming season or leading up to a specific race. What types of workouts and what areas need to be the focus? Should you focus on improving your FTP or are VO2 Max, FRC and PMax intervals more important in preparation? Single out a few races that called on different strengths and revealed weaknesses and see how they break down. Reviewing what percentage of the effort was in different zones allows you to drill down and see where you may have been strongest and weakest during that particular period in your training. You may even cross-reference the race with the same time period on the PD Curve to examine how things were looking on a larger scale.
This interval review is an example of a first place effort in a professional XC mountain bike race. At a glance it’s easy to see that nearly 50% of the time was spent at VO2 Max and above. Knowing what it takes to win makes it easier to formulate training strategies for races to come.
A season review, although critical, can be a lot to dissect. Knowing where to begin and what data to review can make the process much more productive. Whether you’re reviewing your season as a self-coached athlete or with your coach, there’s a lot of value in a critical review of your past performances. Dynamic and insightful tools like WKO4 make finding the data that’s of use even easier. Starting at a larger level to identify macro trends in your training and then narrowing down to the workout level make for a productive approach to analysis. Once you’ve identified your individual strengths and weaknesses, you can apply those insights to your training to make for an even more successful season next year.

