What is the Performance Management Chart (PMC)?
- The Performance management chart helps you plan and measure your training as your season progresses.
- It works by charting your daily Training Stress Score (TSS), which is based on the duration and intensity of each workout.
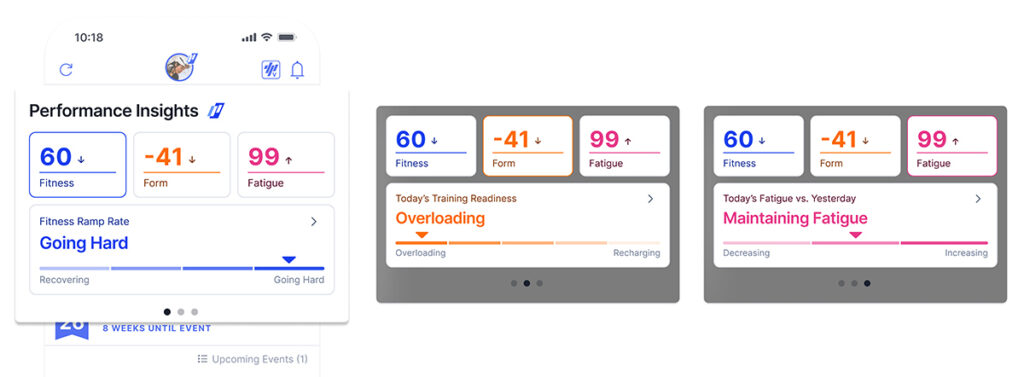
- Your daily TSS can give you valuable insights into your cumulative training, including your fatigue (7-day average), your fitness (42-day average) and your form (yesterday’s fatigue subtracted from yesterday’s fitness).
- The PMC maps these metrics concurrently so you can see how your daily training affects your fitness goals.
Training Stress Score
It all starts with your Training Stress Score (TSS). Every workout you do is assigned a training stress score based on duration and how intense the workout was relative to your threshold. In the main image of this article, we see a red dot representing each day’s workouts for an entire season. The red dots at the bottom of the screen indicates that there was no workout that day.
Fatigue (Acute Training Load, or ATL)
By taking an exponentially weighted average of that stress from the past seven days, we are able to calculate your Fatigue or an estimate of your fatigue accounting for the workouts you have done in the past two weeks. Here you can see on days with a workout with a high training stress score; the Fatigue climbs sharply in response. You do a hard workout today, and you will feel it in the coming days.
Fitness (Chronic Training Load, or CTL)
We also use each day’s TSS to calculate the Fitness score. Fitness is an exponentially weighted average of the last 42 days of training and reflects the training you have done over the last three months. However, the workouts you did 15 days ago will impact your fitness more than the workouts you did six weeks ago. You may notice that as Fitness goes up, so does Fatigue, only at a greater rate. The PMC helps to tell a story, and consistent training is marked by a steady rise in Fatigue and Fitness, whereas a sharp drop might indicate time off due to sickness or injury.
Form (Training Stress Balance, or TSB)
Finally, by subtracting yesterday’s Fatigue from yesterday’s Fitness, we come up with the yellow line or the Form. Just because you are fit does not mean that you are ready to race at your best. A negative Form would indicate that you are carrying a lot of fatigue and are not on form. However, by tapering, you can shed fatigue at a greater rate than you lose fitness and come into form on the day that matters most… race day! In short, Fitness minus Fatigue equals Form.
There is no single Form that works for every athlete, but as a general rule of thumb, you would want to be slightly negative up to positive 25. If your Form becomes too high, it may indicate that you tapered too much and have lost fitness.
Looking at Form can also give you clues into how much stress you can handle before getting sick or injured. Going forward, you would also know to take some recovery days prior to reaching that negative number.