
Completing an event is ultimately a race against yourself. Seeing if you can go a little bit faster, a little bit longer, or a little harder each time. Training for an event is about incremental improvements—numerous small and consistent changes that yield positive results over time.
Train smart
At TrainingPeaks, we have found that the best way to train is to choose a specific goal (e.g. a race), then get expert instruction and focused training (through a coach, a training plan or a personalized Annual Training Plan) with regular feedback in order to reach your goal. This type of deliberate practice has worked for world champions and committed endurance athletes of all levels.
A key component of this methodology is the feedback you receive. Whether it involves a coach analyzing your workout files or you managing your own TrainingPeaks dashboard and fitness metrics, getting immediate feedback allows you to plan and track your training in the most optimal way.
Getting started with TrainingPeaks
Knowing exactly what to measure and how to do it most efficiently can be overwhelming—but only at first. There are a wide range of available devices in which to record everything from distance and duration to heart rate, power, cadence, and more. If you are an athlete just starting out and not quite ready to make the investment in a GPS device, there are several smartphone apps that can record your workouts. Once you have decided on how you are going to record your workouts, the next step is uploading them to your TrainingPeaks account.
Once your workout is in your account you can click on the completed workout, which will open a quick view summary of information, including how long the workout was and how far you ran or rode. You may also notice some three-letter acronyms listed as well, such as TSS and IF—but what the heck do they mean, and how can you use them? These abbreviations represent some of the metrics that you will find in TrainingPeaks, and they are the key to measuring improvement and reaching your potential!
TrainingPeaks metrics primer
Functional Threshold (FTP)
Most of the metrics in TrainingPeaks are based on a Functional Threshold (Power, Pace, or Heart Rate), so it is important that you have this right before jumping ahead to some of the other metrics. Functional Threshold represents the maximal effort you can maintain for around an hour without fatiguing. For some athletes this will be less than an hour and for others it might be slightly longer, but the important thing is that it provides a useful benchmark by which to measure your training.
To get the most accurate number you will need to perform an hour-long test and then use the average power, pace, or heart rate from that test as your threshold. However, going all out for an hour is HARD and requires a lot of focus and motivation—not to mention it could be very disruptive to your other training. So instead of performing an hour-long test, consider using one of these other methods, which are shorter but still provide a good estimate of your Functional Threshold.
You can learn more about getting started training with power here.
Setting zones
Once you have determined your functional threshold, you will want to use that number to establish your training zones under your account settings. In the TrainingPeaks web app, click your name in the upper right, then select “Settings.” Next, click “Zones” on the left-hand side. You can choose from Heart Rate, Power, or Speed/Pace. The zones you choose will depend on what sport you are setting the threshold for (e.g. cycling, running, and swimming). You can have multiple types of zones for a single sport.
For example, if you are a runner and have a GPS device and a heart rate monitor, you would want to set both a pace threshold and a heart rate threshold. Select the type of threshold you want to set from the left, then scroll down past “Default” and select “Add Activity.” Select the sport type from the drop down menu. Next, enter your threshold in the box, then under “Auto Calculation” choose “Threshold,” and under “Method” select which methodology you want to use, such as Joe Friel or Andy Coggan. Finally, select “Calculate” and you will be provided with zones that represent the pace, heart rate, or power you would want to target for different workouts based on what you are working on that day. For instance, if you are out for a general endurance run, you would probably want to spend most of your time in Zone 2.
Normalized Power (NP) or Normalized Graded Pace (NGP)
In cycling, NP provides an estimate of the metabolic cost if the ride would have been paced steadily and places an emphasis on the surges during the ride.
Think of riding your bike like driving a car. You are going to use less gas while driving on the highway at a steady speed than you would driving in the city and constantly having to come to a stop and hit the gas again to get back up to speed. NP provides a picture of how hard a ride felt, so while the Average Power may be relatively low, the Normalized Power could be high due to surges in speed throughout the ride duration.
In running, NGP takes the hills into account and estimates what your pace would have been if you were running on a flat course.
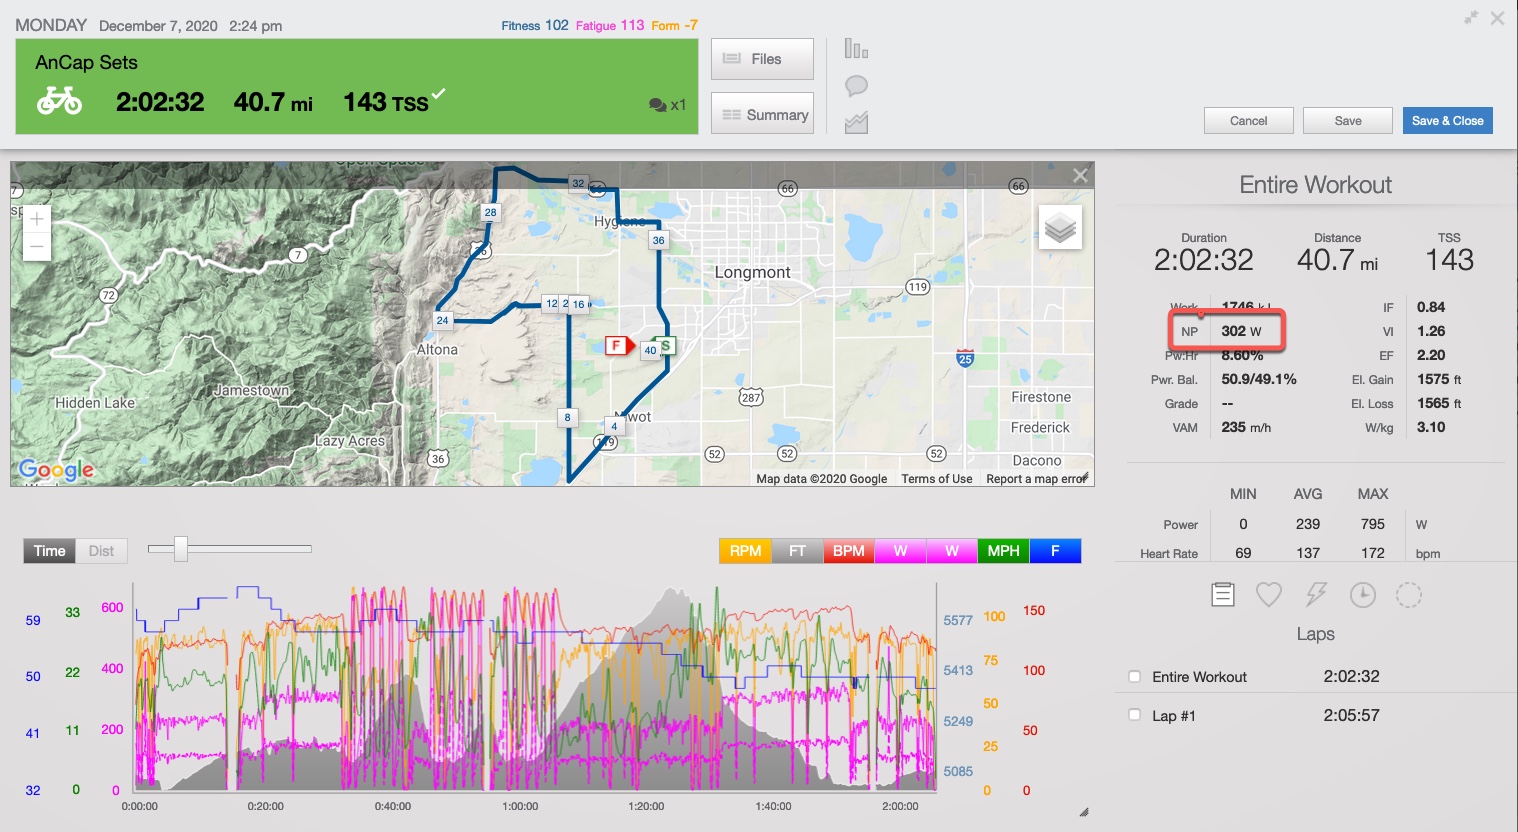
Intensity Factor (IF)
Now that we know how hard we can go for around an hour (FTP) and we have a way to estimate how metabolically taxing a workout was (NP/NGP), we can now measure how intense that workout was relative to our threshold through the Intensity Factor (IF).
IF is simply how intense a workout was relative to your threshold and can be read as sort of a percentage of 1, with 1.0 being your threshold. If the IF for your workout was 0.80, we could say that you performed that workout at 80% of your threshold.
General endurance work falls in the 60-70% range, while a harder tempo workout would be closer to 80-90%. Additionally, depending on the duration of your race, you may see an IF of up to 105%, or 1.05. IF is calculated by dividing your NP or NGP by your functional threshold. So, if your FTP is 250 watts and you did a workout with an NP of 200 watts, then you would end up with an IF of 0.8, or 80% of your threshold.
In addition to providing information on the relative intensity of your workout, you can also use this number to get an idea of the relative intensity of different race durations.
| COMMON RACE INTENSITY FACTORS | |
|---|---|
| RACE TYPE | COMMON INTENSITY FACTOR |
| IRONMAN (AGE GROUP) | 0.60-0.70 |
| IRONMAN (ELITE) HALF-IRONMAN (AGE GROUP) | 0.70-0.79 |
| HALF-IRONMAN (ELITE) LONG ROAD RACE MOUNTAIN BIKE MARATHON | 0.80-0.89 |
| OLYMPIC AND SPRINT TRIATHLONS LONG TIME TRIAL SHORT MOUNTAIN BIKE RACE CRITERIUM | 0.90-1.04 |
| SHORT TIME TRIAL | 1.05-1.15 |
Republished with permission of VeloPress from The Power Meter Handbook by Joe Friel.
Training Stress Score (TSS)
Finally, we have Training Stress Score®, which is a score given to a workout to tell you how hard it was. Whereas IF told you the intensity of a workout relative to your threshold, it is only one side of the equation. If you did a workout at 90% of your threshold for two hours, it would surely be much more stressful than doing 90% of your threshold for 45 minutes.
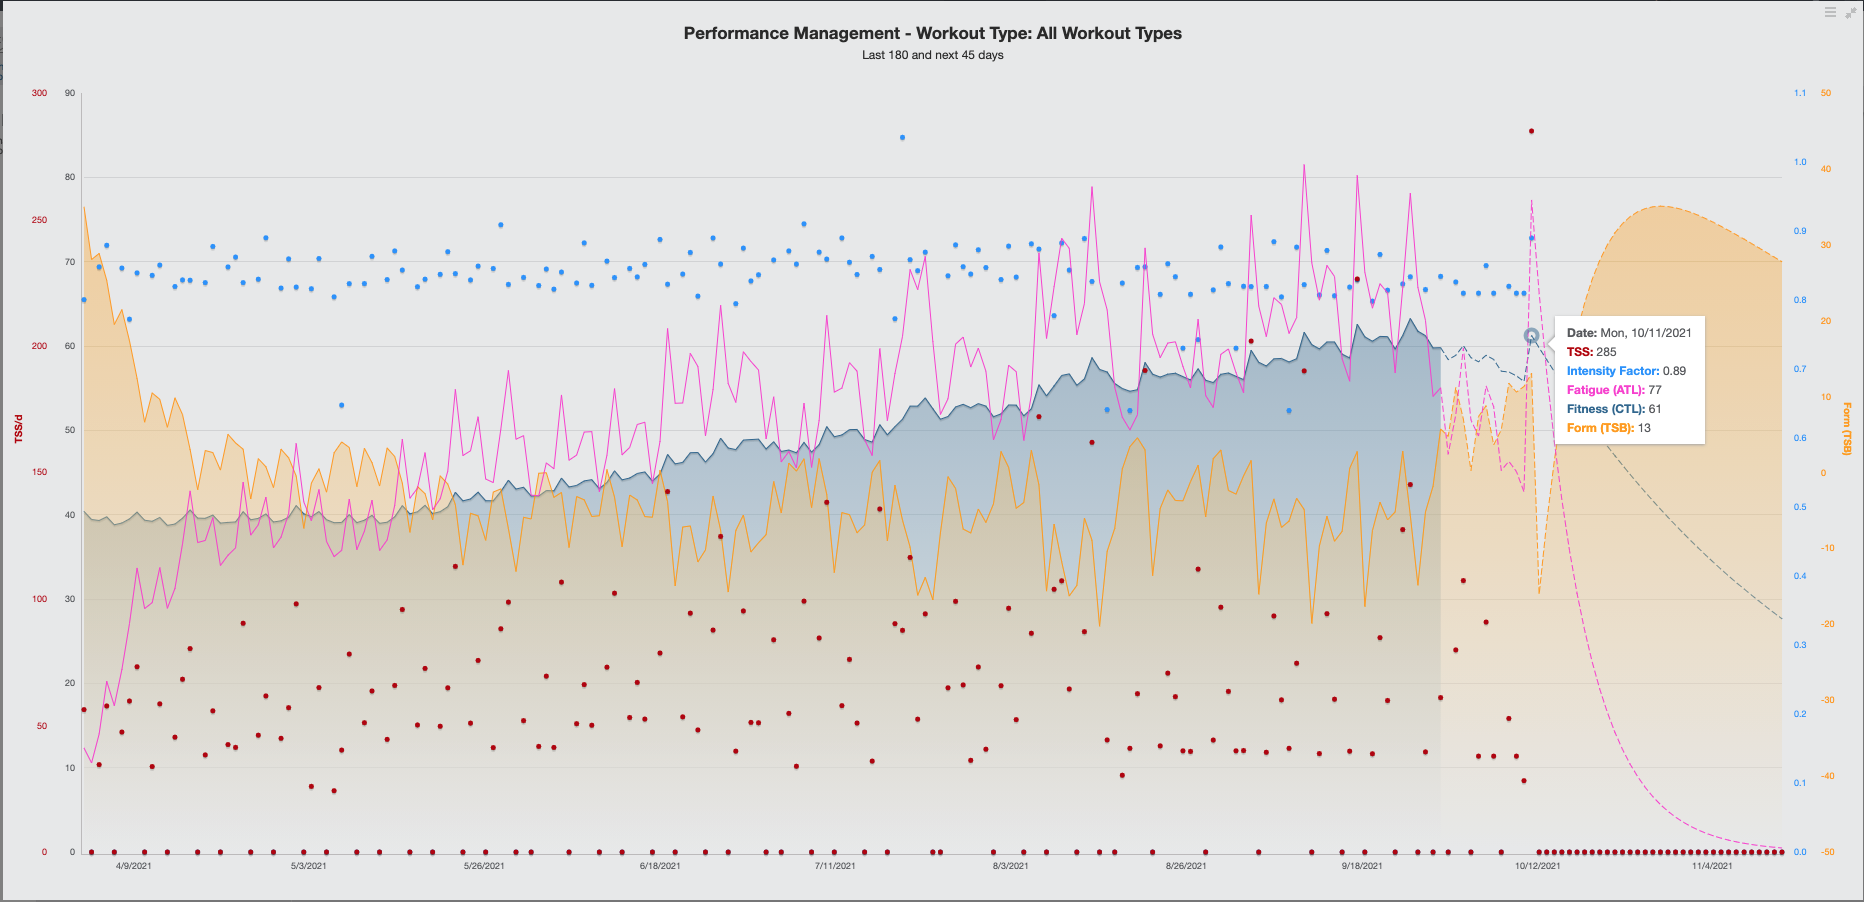
TSS takes both intensity and duration into account and provides you with a more complete view of how stressful that workout was in the overall picture of your training. To take this idea a step further, TrainingPeaks uses this daily TSS to model your Fitness, Form, and Fatigue by using a weighted average of a set number of days and modeling them in the Performance Management Chart. All of this provides you with an invaluable way to visualize your training load and plan the perfect peak for your next event.
Every athlete wants to be as prepared as possible for their next event in order to set a new personal best, get on the podium—or win! By recording your workouts and using TrainingPeaks metrics to plan your training and track your progress over time, you will be headed down the path to optimal performance.
