
Many of us
There are many limitations when training with heart rate that monitoring SmO2 does not have. Not only can SmO2 be localized to specific muscles (unlike heart rate, which is a systemic measurement), but it gives measurements in real-time. This allows athletes to understand exactly when the body switches from aerobic to anaerobic during an interval, and the exact pace and duration at which that interval is most effective.
What is SmO2?
Quite simply, muscle oxygen saturation (SmO2) is the balance between oxygen delivery and oxygen consumption in the muscles. During exercise, your muscles are working harder, increasing demand for oxygen. As a result, your heart rate is elevated and breathing increases to supply more oxygen to the working muscles. Oxygen is then used to oxidize any available glucose into adenosine triphosphate (ATP) to provide energy.
As intensity increases, your body is no longer able to meet your muscles’ oxygen demands and glucose is converted into lactate. You are switching from working aerobically to anaerobically, which can only be sustained for a limited amount of time. This is why lactate threshold blood testing has become one of the most commonly used indicators of performance; lactate is an indirect measurement of how efficiently your muscles are using oxygen.
How is SmO2 Measured?
Monitoring SmO2 was previously only available using expensive bench-top lab equipment but with the advent of wearables is now accessible to all of us endurance athletes. The Moxy Monitor, the
Case Study #1: Running at Endurance Pace
When training at aerobic intensities, the goal is to train oxygen-dependent energy systems (i.e. aerobic respiration). At these lower intensities, the training duration can be much longer (such as long endurance rides or long, slow distance (LSD) runs).
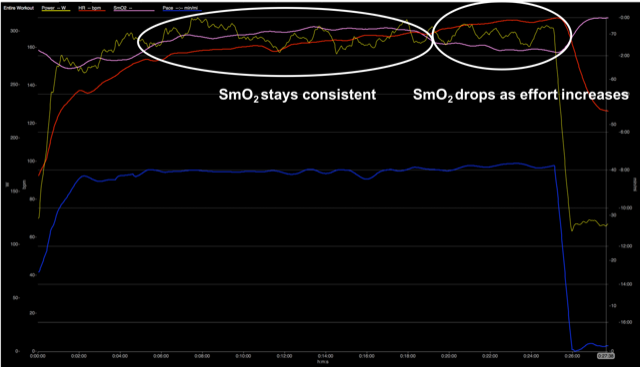
After the warm-up period, the athlete ran a 5 km form-focused Tempo run. As the pace stays consistent within the Tempo pacing range, SmO2 was linear as HR
Towards the end of the workout, the athlete ran a 1 km supra-threshold effort. Here, we can see a significant divergence in HR and SmO2. This means muscle oxygen consumption was greater than the oxygen being supplied, meaning an unsustainable (anaerobic) effort (as shown in Figure 2)
The takeaway from Case Study #1 is that during endurance intensities, muscle oxygenation will be at a steady state. This also shows that monitoring muscle oxygen is an excellent way to monitor workout intensities.
Case Study #2: Cycling at Threshold
Intensities at threshold increase the body’s metabolic demand. Significant changes, such as a decrease in the body’s pH; increases in core temperature; and increases in CO2 concentrations occur at higher intensities. These changes affect the body’s ability to produce ATP through aerobic respiration. Monitoring changes in SmO2 will demonstrate this and help optimize and improve your interval workouts.
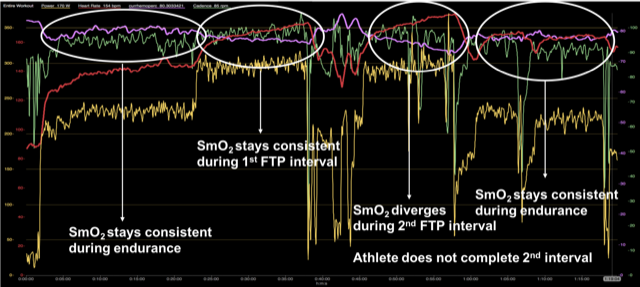
The traces depicted are power (yellow), HR (red), SmO2 (purple), and cadence (green).
As shown in Figure 2, the athlete performed 2×20 min Z4 efforts on the bike. During the first interval, HR increased as the power effort and SmO2 remained consistent. However, the dynamic changed during the second interval even though it was at the same power as the first.
This is a result of muscle fatigue late into the workout. SmO2 began to decrease almost immediately as the interval began. This drop in SmO2 shows the muscle’s oxygen demand was greater than what was supplied indicating an unsustainable effort, which also results in lactate formation. This resulted in the athlete’s inability to complete the second interval.
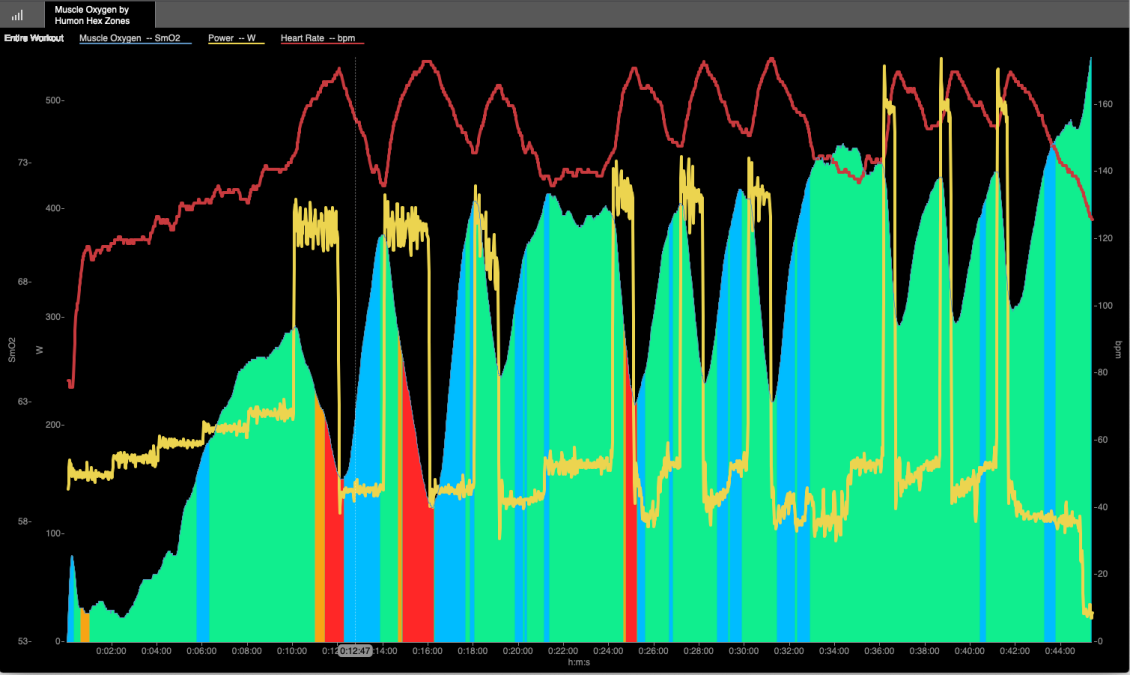
Figure 3: Cycling Anaerobic Capacity intervals. The traces depicted are power (yellow), HR (red), and SmO2, which is shown by Humon’s real-time training zone colors (red, orange, green and blue).
In Figure 3, an athlete performed three sets of anaerobic capacity (AC) intervals at three different durations. During each interval, denoted by the change in power, SmO2 drops significantly. The general principle to explain this is that ATP demand for these efforts outpaces the muscle’s ability to produce ATP anaerobically. After each interval, you can see that the athlete’s SmO2 increases as soon as they reduce intensity, and oxygen supply becomes once again greater than the demand.
By knowing the point at which your (or your athlete’s) SmO2 drops low enough to cause fatigue, you can guide pacing at these training intensities. You can also gauge when muscles are fatiguing at the end of a workout, and adjust
During the workout in Figure #3, the athlete was wearing a Humon Hex SmO2 sensor, with the Humon Hex Connect IQ data field installed on their Garmin device. Humon created the easy-to-read colored training zones you can see in Figure 3, and they’ll also appear on your Garmin display to help you understand your SmO2 status in realtime.
When using this data field, SmO2,
Further Uses
SmO2 monitoring has many other use cases starting with an optimized warm-up and ending with the proper recovery. One of the most valuable ways to use SmO2 is to determine your lactate threshold without having to complete an invasive lab test where blood needs to be drawn.
SmO2 devices provide vital insights into how muscles are exerting during training that
