
As more and more data inundates cycling, and more riders have access to individualized data, it has become more important to know what exactly to focus on. Specifically when talking about training with power there are a handful of terms that always seem to enter the conversation. Functional Threshold Power (FTP), PMax (max power for one full pedal rotation), and Chronic Training Load (CTL or Fitness) are just a few. However, there’s one metric that comes in and out of the discussion that’s extremely important for all riders to focus on, and that is Watts per Kilogram (W/kg).
Watts per kg provides athletes and coaches a metric to compare riders of different body composition to one another, as well as understand how effective an athlete’s training is for the demands of a specific ride or race. There are several ways to improve your W/kg once you understand how to train it and why you should train it. Shifting some of your focus towards this metric will no doubt produce big gains on the bike.
Why Is Watts per Kilogram Important in Cycling?
For the cyclist that rides on completely flat roads or trails, W/kg isn’t very important. If the terrain is flat, then the rider with the highest absolute power will almost always go faster. However, for athletes that ride regularly in hilly terrain, compete in events with climbs, or want to be more proficient sprinters, W/kg should be a primary focus. Here’s an article that helps explain why power-to-weight helps you ride faster.
Unlike many of the other metrics cyclists track, W/kg is relatively straightforward to improve. There are only three ways in which you can affect some change in your W/kg. They are as follows:
- Increase your power output while keeping your weight constant.
- Keep your power output constant while decreasing your weight.
- Increase your power output while also decreasing your weight.
Any of these straightforward methods, when approached correctly, will produce the desired result of increasing an athlete’s W/kg. It’s important to first identify what approach will work best for you, and then develop a plan that will properly integrate the training necessary to achieve your goal. Once you’ve identified your approach it’s time to get stronger.
How Do I Increase My W/kg Ratio?
You’ll first want to calculate your power to weight ratio for a given range. To do this, divide your body weight in kilograms (1kg = 2.2 lbs) into average watts for a given range. It’s a good idea to do it for several durations so that you know where you’re strongest and weakest.
Unlike FTP or PMax, W/kg is not a static number, but rather one that corresponds to different durations on the power duration curve. For the purposes of power profiling there are four standard durations: 5 second, 1 minute, 5 minute, and FTP. These are the durations that best reflect neuromuscular power, anaerobic capacity, maximal oxygen uptake (VO2 Max), and lactate threshold (LT), respectively1. When using a tool like WKO4 you can quickly see where it is that you’re strongest and weakest and set your goals based on your power profile.
Sample Watt per kg Chart
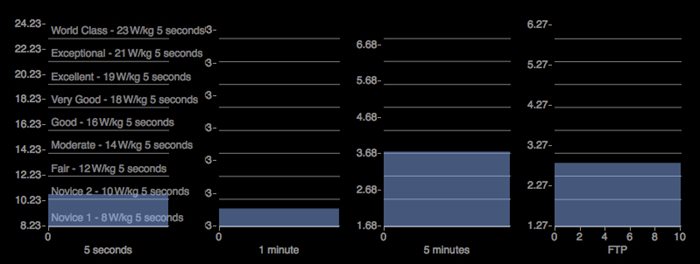
By drilling down and focusing on where it is you need improvement you can begin to train those systems accordingly. If you’re looking to be a great sprinter then neuromuscular and 1-minute power will be important. If long climbs are where you need to improve then 5-minute and lactate threshold efforts should be a focus. The chart above shows an athlete’s profile where the focus has been on explosive climbing and bridging gaps in rides and races. While we’re not there yet, there’s been tremendous improvement in the last 6 weeks once we honed in W/kg.
Weight Loss
One of the areas where most riders can see nearly immediate gains in their power to weight ratio is by losing fat and gaining or maintaining lean muscle mass. If your aerobic capacity stays the same, meaning you maintain the same fitness, but lose weight, you’ll see an increase in your W/kg. For most recreational riders, this is often the best approach to improving this metric. However, this should be approached with caution as you don’t want to get too light. The minimum body fat range for men is 6 percent and for women is 14 percent. Dropping below these ranges can negatively affect your health and performance2.
Strength Training
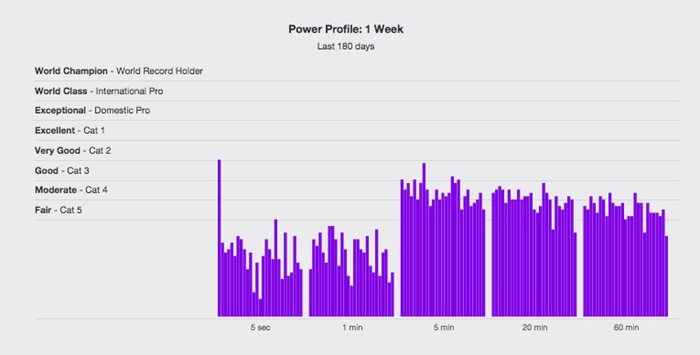
When most cyclists think about getting stronger they immediately think about riding more and harder. However, one of the best ways to get stronger, and consequently increasing W/kg, is time spent off of the bike in the gym. Strength training should be an integral part of every athlete’s training, but particularly those that are focused on increasing power output. Heavy resistance training for key cycling muscles (quadriceps, hamstrings, buttocks and calves) not only boosts muscle efficiency, it can help prevent the loss of muscle power during periods of high-volume training, or during periods of weight loss3. Another place to analyze and compare your power against standards is by using the power profile in TrainingPeaks. You can quickly see each week compared to the last and pinpoint the improvements that your strength regimen is helping you make.
What Happens When W/kg Improves?
As you replace fat with lean muscle on your way to a higher strength to weight ratio, your body composition changes. Outside of being stronger and lighter, there are other benefits to having more lean muscle, one of which is water retention. Muscles carry approximately 70 to 75 percent water while fat is made up of only 10 percent water4. Since a 3 percent loss in body mass due to dehydration can result in up to an 8 percent loss in performance it’s easy to see how adding muscle that aids in water retention can have huge benefits to your overall performance5.
The change in your body’s composition also causes adaptations on a cellular level. While you train your weaknesses with sprints, intervals, hill repeats, and strength training you’re also changing the way your body consumes oxygen and processes lactate. Your body’s uptake of oxygen, often referred to as VO2Max, is increased as you focus on building strength and aerobic capacity. This allows you to perform efforts outside of your lactate threshold (105 to 110 percent) for longer durations. Increased efficiency in oxygen delivery helps your body to more quickly buffer lactic acid. This increased efficiency means that you spend less time anaerobic when you begin your next sprint or big climb. While your focus on W/kg will no doubt have you feeling stronger and looking leaner, you’ll also be building a healthier and more efficient body.
As access to data becomes more readily available, the conversation around what data is most important in cycling continues to evolve. It can be a challenge for athletes and coaches alike to hone in on what’s important for a given individual. While threshold and other metrics are certainly part of the equation, W/kg allows for a certain leveling of the playing field, putting athletes of different sizes and abilities side by side.
If the terrain you’re riding is flat then focus on absolute power, otherwise W/kg should be a primary focus. Use it to highlight where you shine and where you can stand to see improvements. Compare it against your goals to see how you stack up against other riders and what you need to do to get stronger. Once you identify the best way for you to approach gains in your strength to weight ratio, you’ll begin to quickly see why it’s worth focusing on.
References
- (2021, November 4). Power to weight ratio: watts per kilogram explained and how to boost yours. Retrieved from https://www.cyclingweekly.com/fitness/training/the-importance-of-power-to-weight-and-how-to-improve-yours-164589
- Ryan, M. (2007). Sports Nutrition for Endurance Athletes.
- Bardis, C.N. et al. (2013, November). Mild Dehydration and Cycling Performance During 5-Kilometer Hill Climb. Retrieved from https://www.ncbi.nlm.nih.gov/pmc/articles/PMC3867084/


