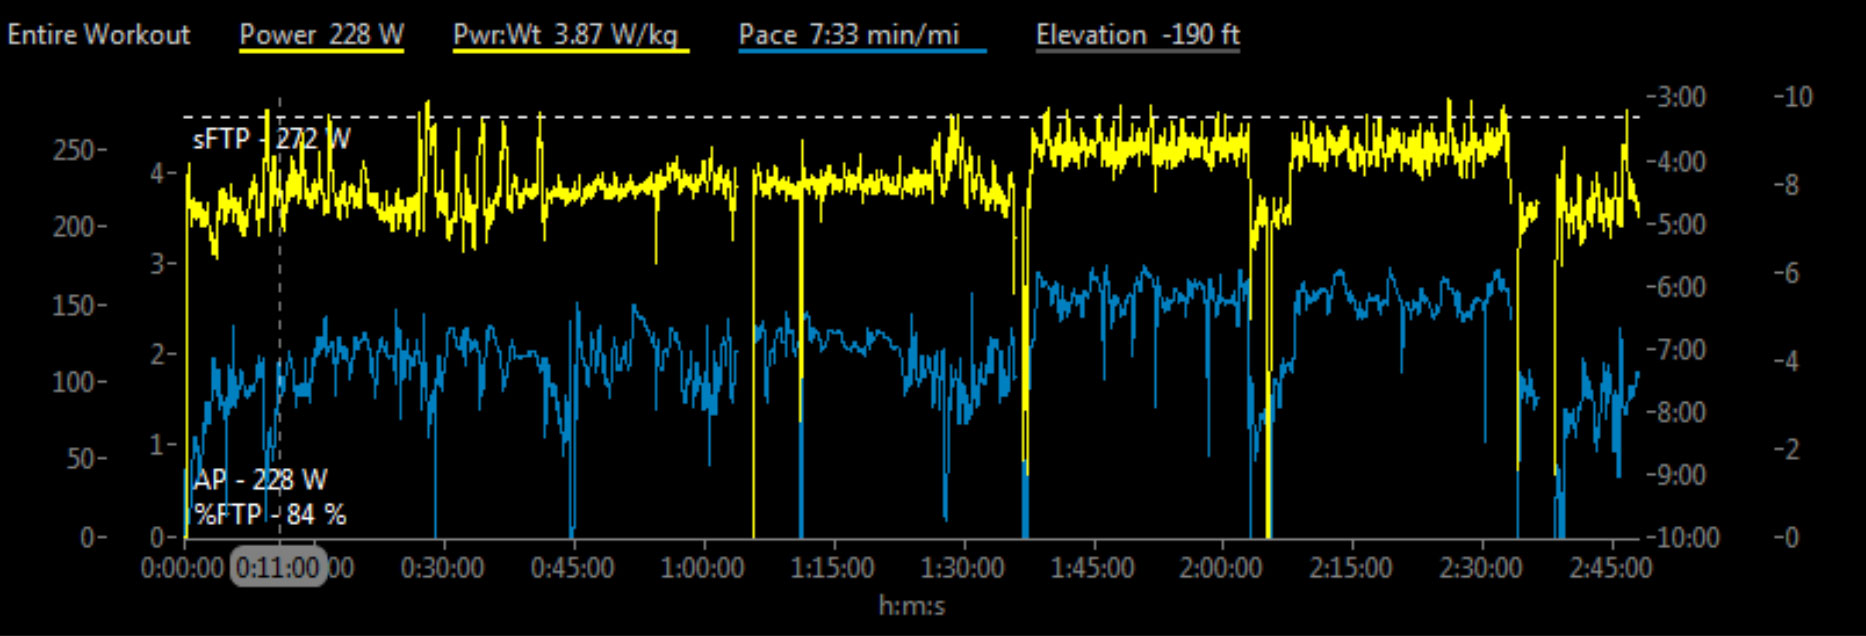
An athlete recently contacted me after a run workout to report how he felt during the prescribed efforts. The workout was a long run of 23.6 miles with 2×25 minutes at ~92 to 94 percent of FTP, with five minutes of easy running between the intervals. It was certainly a challenging workout (the runner is targeting a marathon PR).
“The first 25 minutes was totally fine,” the athlete told me. “The second one was mildly rugged for the last 12 minutes or so.” Then he said, “For what it’s worth, it was definitely my legs crapping out that made the last couple of miles tougher. Breathing/aerobic stuff was totally fine.”
His comments made me curious to find out what may have happened. Temperature changes or hydration/fueling status changes could have caused the struggle of course, but in both of those cases, one might expect some tell-tale regression of power or other fatigue barometers. The same would be expected if the run and associated efforts simply fatigued the runner into decline.
The first data I looked at was the athlete’s power for the entire run (see the chart below). Was there any obvious visual evidence of a tailing off?

Answer: No.
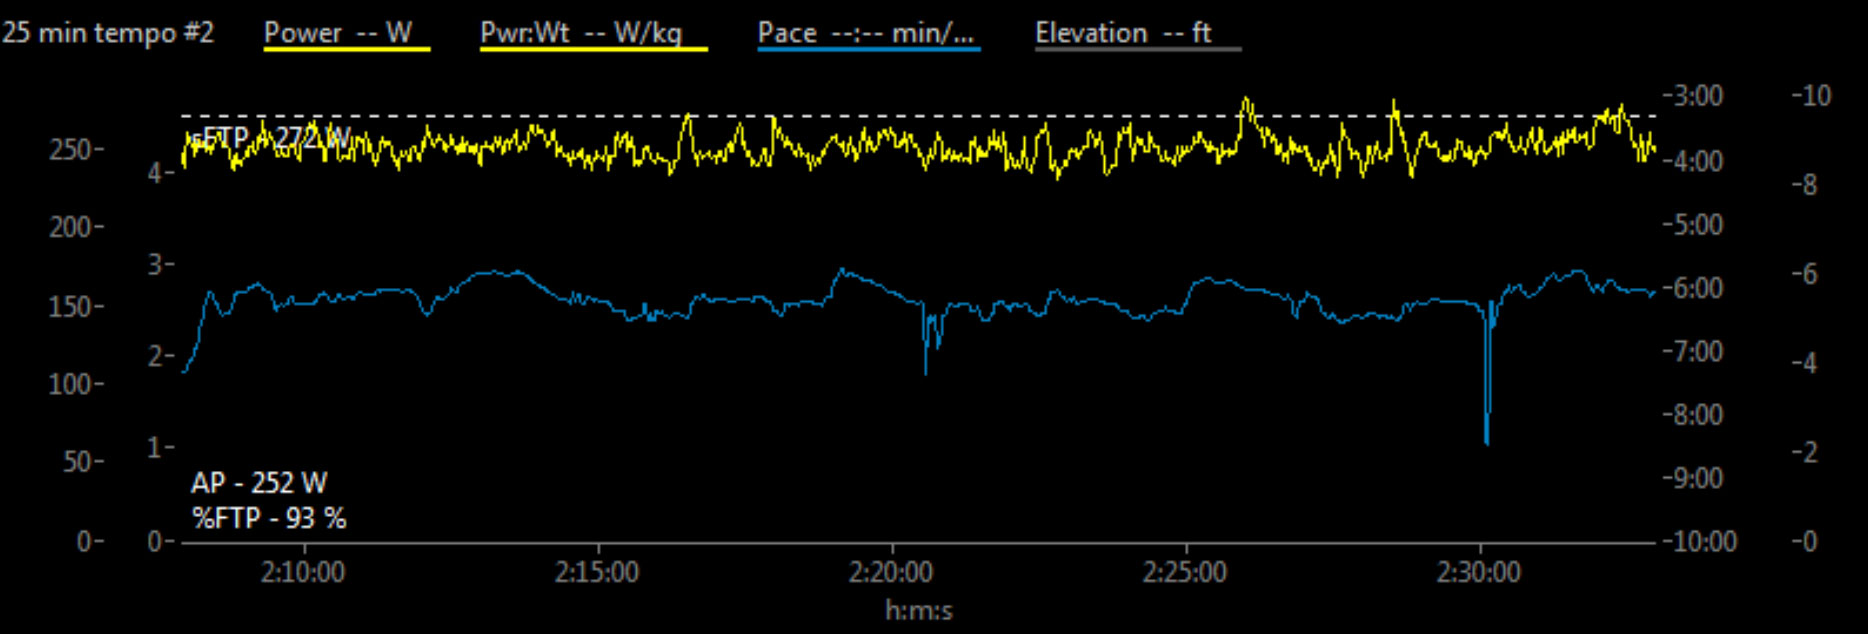
I then looked at the second tempo effort by itself. Was there obvious visual evidence of a tailing off there?

Answer: No.
I decided to dig a little deeper into that second tempo effort, using some specialty reports and charts I’ve custom built in WKO4. First, I loaded a report that calculates the percentage difference of various metrics between the first and second halves of an effort.

In the second half of the second 25-minute tempo effort, the runner’s power was up 4.6percent, his speed up 10 percent, and his RE (Running Effectiveness) up 6.1 percent. Pretty good! Further, his horizontal power ratio was up 1.3 percent and his leg spring stiffness (LSS) was up 0.8 percent, while his ground contact time (GCT) and vertical oscillation both decreased. His flight phase, cadence, and stride length all increased. The power:GCT ratio (a good marker of fatigue) actually improved by 5.8 percent. In other words, the metrics suggested that despite the runner’s struggling, the production was still there and improving.
Just to confirm the report, I took a look at the recordings for various fatigue indicators over the course of the second tempo effort.

No suggestion of failing was evident.
What a great effort! Yes, RPE was going up, and it was hurting more to maintain power and speed, but the work was executed, and quite well as a matter of fact! It was perfect marathon training. After all, somewhere in that last 10K of a marathon, we want to be able to dig deep but still produce power and speed.
Summary
Running with a Stryd power meter certainly helps runners to execute a workout at prescribed power, and a robust analysis of the data (such as with the user-customizable WKO4 software) allows both coach and athlete to objectively determine if and how the workout was executed. In this case, instead of finding a failing, we found an impressive performance.
Learn more about how WKO4 can help you dig deeper into your workout analysis for better performance with a free 14-day trial.


