The amount of technology available to endurance athletes is astonishing. New devices, updated devices, and new brands are hitting the market almost every month, which is continuing to drive the cost down and making it more and more accessible for every-day age group athletes. However, the real question is what do these different numbers tell you about what you are doing (performance) and about how your training is going (fitness).
Technologies such as heart rate monitors (HRM), power meters, GPS devices and speed-distance devices provide a huge advantage to athletes that have them, know how to use them not only in training, but in racing, and most importantly, analyze the files they each generate.
This isn’t an article about analyzing files, it’s about what the technology is actually measuring while you’re training and racing. Understanding what you are seeing when you look at your watch or cycling computer is the first step to getting the most out of technology.
Why Do We Measure Intensity
When I ask triathletes why they have a device on their bike or on their wrist when they swim, bike and/or run, “measuring intensity” is the most common answer. This is a great reason to invest in the technology; being able to tell how hard you are going is obviously important during the session or race. Having the workout files these devices generate after the session and/or race is where the technology really takes off for athletes!
Today’s devices measure intensity such as beats per minute or wattage, while some measure work metrics such as speed (distance/time) and cadence (strokes or steps/time). Each metric provides value while training or racing, as well as after you have completed a session or race. The key is to know what to look at and when.
Metrics such as heart rate (HR), rate of perceived exertion (RPE), speed and power all measure intensity. RPE is the most subject way to measure since it is based on what you are feeling at the time and after a session or race. Heart rate is obviously the direct measurement of beats per minute. Variables such as hydration, temperature, mood, sleep quality and nutrition contribute to HR and RPE, both positively and negatively. We need to keep this in mind when looking at the available metrics and deciding which metric(s) are best for you while training and while racing.
Wattage and speed on the other hand are clearly measured and understood. In simple terms, wattage is the measurement of force you are applying to the pedals, where speed is how much distance you are covering in a given time (miles per hour). These metrics have no variability. In order to use these metrics to measure intensity, we have to base them around a physiological marker, such as lactate threshold (LT) or Functional Threshold Power (FTP). When we tie these two metrics to a marker, they can be used to measure the intensity of an effort.
Input Versus Output
So we’ve covered all the metrics that are commonly used to measure intensity for swimming, cycling and running. The next step is understanding what other differences are there between the metrics and which should you use. To better understand the metrics I’ve covered, we have to look more closely to see the differences in what they are measuring in terms of input and output.
“Output metrics measure performance while input metrics measure what effort is required to generate a given output.”
Outputs are measured using speed and power. They are performance-based metrics that directly measure how fast you are going. They are measuring the power output or speed required to ride a 5:30 bike split or run a 3:15 at an Ironman. Input metrics such as HR and RPE tell us what effort is required to generate a given output. They measure how hard you have to “work” to run a 7:00 mile off the bike at an Ironman.
At the end of any race, the winner is the person with the fastest time, not the person who worked the hardest. This is why using output-based metrics is the better way to measure your training and racing. Metrics like Threshold Pace for swimming and running, and FTP for cycling will tell you what intensity you are swimming, cycling and running at, from a performance standpoint, which at the end of the day is what we are out on the course for.
Using Input Metrics
Now that we have clearly defined what an output metric is and the value they provide, what do we do with the input metrics? Do you still need to be recording heart rate? The answer is yes, absolutely!
The performance metrics are obviously important, but so are the input metrics. Remember, they measure the effort required to move a given distance. Let’s explore this using the following example:
A triathlete goes out for a ride on their favorite bike loop near home, which is 12 miles. They ride this loop once a week as hard as they can go to see how their training is progressing. Let’s assume they generate the follow data over a 4 week training block:

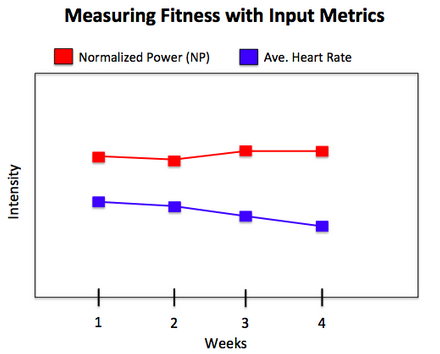
We see the output metric (Normalized Power®) remaining fairly consistent while the input metric (average HR) is steadily dropping for each session. This is illustrated in the following graph.

This trend is showing the athlete has become more fit over this four-week period. The output (performance) stays relatively the same, with the input (effort required to generate the performance) is decreasing! Performing the same output at a decreased input is particularly critical for long course athletes.
Now you know what input and output metrics are, how they are measured as well as how and why to use them while training and racing, as well as after the session. If going faster on race day is the goal, this knowledge could make all the difference.


