
In the new WKO4 software, one of the many new features is the ability to create your own custom charts and graphs. You can make these as simple or as complicated as you like, and this can allow you to experiment with new ideas and see if there is a correlation or trend you can learn from. The other great thing about WKO4 is that you don’t have to do a single custom chart or know calculus. There are many charts to pick from inside the Chart Picker and also on the Chart Exchange online and you get to benefit from the brain power of super scientists and mathematicians, like Dr. Andrew R. Coggan.
Dr. Coggan has been working hard on his newest creation, the Elevation Correction Chart. For years, we have known that the power you can generate at “elevation” versus sea level is a lot less. How much less depends on your elevation, your unique physiology and a host of other factors. Well, Dr. Coggan has done it. He has created a chart that takes into account these factors and using the computing power of the WKO4 software, anyone can see what their power would be had they been at sea level instead of 11,000 ft.
At the recent USA Pro Challenge in Colorado, all of the riders were impacted by the elevation in one way or another. Australian based Team Drapac rider Lachlan Norris proved to be one of the top riders, placing 6th overall. The team did what they could to prepare for the USA Pro Challenge before the race, but every rider is different and altitude can be very difficult to deal with. Now, after the race, Norris and the team have shared his data with us to show what his power would have been had he been racing at sea level.
Norris’ Elevation Corrected Power
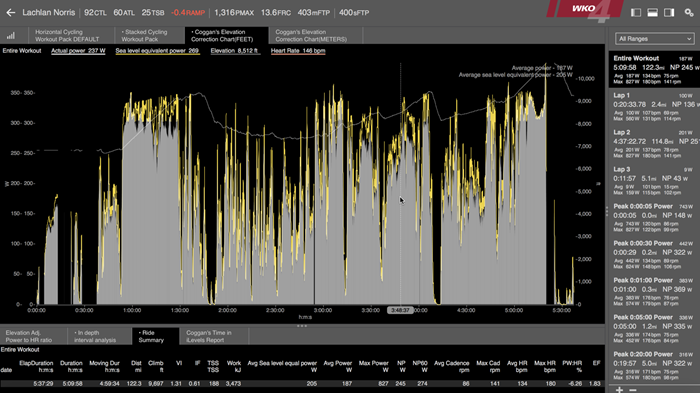
Norris had many good rides during the week and came to the USA Pro Challenge on the heels of a stellar win on the final stage of the Tour of Utah. In Figure 1, Norris’ Average Power for Stage 2 was 187 watts and his sea level corrected average was 205 watts. Stage 2 had a combined climbing of 9,697 ft. The stage started from 6,800 ft., climbed to 9,000 ft. twice, and then finished at 10,000 ft. at Arapahoe Basin. The most dramatic difference between the two came in the first hour of the race as Lachlan climbed from 7,000 ft. to 9,500 ft. His Average Power for this section was 297 watts, but the sea level equivalent power was 342 watts.
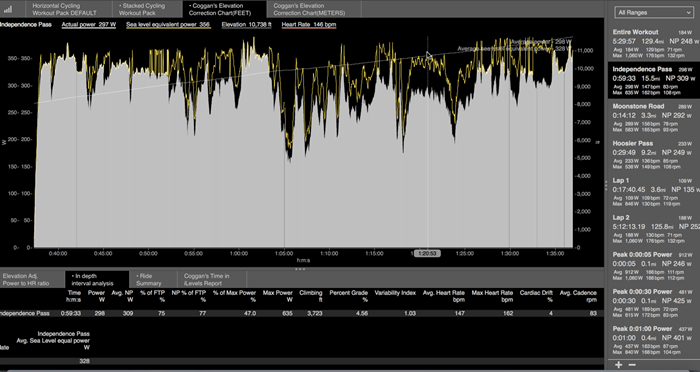
In Stage 4, from Aspen to Breckenridge, there was a tremendous difference in the sea level equivalent power and the actual power. In the first climb of the day over Independence Pass, topping out at 12,000 ft., Norris’ actual power average for the climb was 298 watts, but his Sea Level Corrected (SLC) was 328 watts. Notice in Figure 2, that the higher and higher he climbs, the more there is a discrepancy between his actual power and SLC. Near the top of Independence Pass, his actual power is nearly 60 watts lower than SLC.
In Stage 6, the peloton rode at some of the lowest elevations of the USA Pro Challenge and as a result, Norris’ power was very similar to what it would have been at sea level. For the entire stage, his actual power was 208 watts and his SLC was 218 watts, so a mere 10 watts different. Now, remember this might be the case for you, and everyone reacts differently to riding at elevation, but for Norris, 10 watts isn’t much. Clearly, he rides very well at elevation!

Sea Level Correction is a great new chart inside WKO4 and you’ll soon see it in the Chart Exchange so that you too can use it to analyze your data while at elevation. Of course, knowing your SLC power leads to being able to have a SLC TSS as well! So, look for that to follow in the footsteps of this great new chart.
