
The Men’s Olympic Time Trial will challenge the world’s top cyclists over a 54.5km course with several difficult climbs. With several riders in contention for the win, it will be an exciting race to watch. Get an inside look at how the course and weather will effect the riders, and view the power the top riders produce to contend for Gold.
Description
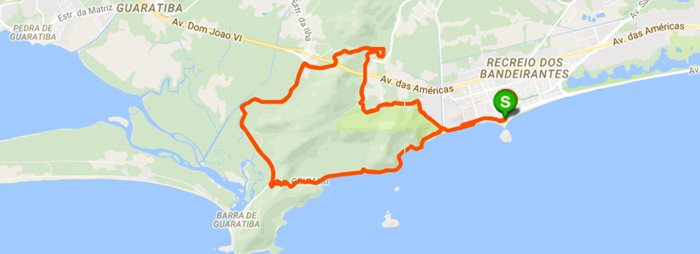
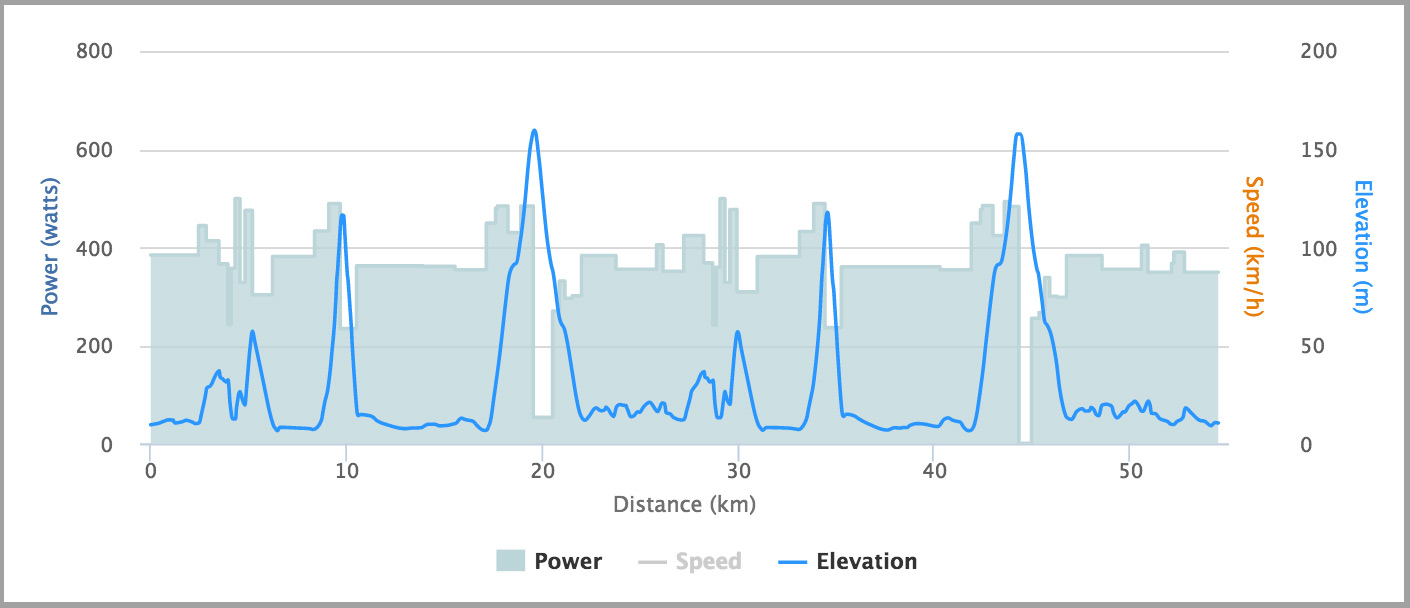
The Olympic Men’s Time Trial course is challenging in both distance at 54.5km and terrain with two loops up the steep climbs in Grumari Natural Park. The course starts and ends in Pontal, and utilizes the same Grumari circuit from the road race. The riders will face two loops instead of the four featured in the road race. The course has paved over a section of the cobbles for the time trial so riders will have smooth roads for both loops, but will still have to face two category four climbs. The first climb is again the appropriately named Grumari, averaging 7 percent grade for 1.2km, with the steepest sections of the climb top out around 12.5 percent. The second climb is the Grota Funda, which is a bit longer at 2.1km but features lesser gradients around 4.5 to 6 percent. After two loops riders will head back into Pontal.
Weather
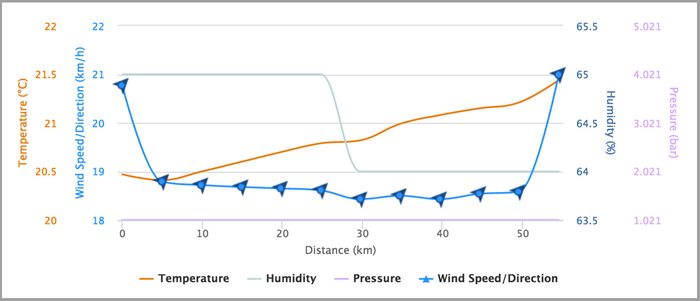
The road race featured mild wind for the most part. The time trial will be a bit different with strong winds coming from the southwest hovering around 20 km/h. Luckily, it appears that the wind will be fairly consistent from the beginning to end of the start times so there should not be a big advantage for the early or late starters. A lot of the course is fairly sheltered once into the circuit, but the run up the coast at the beginning of each lap will be a head/cross wind. After finishing the second circuit loop they should pick up a nice cross/tail wind that will see them hitting speeds in excess of 50 km/h.
Analysis
For this time trial analysis I wanted to dive into the how I go about doing some of the predictions we do for big races. A lot of the methodology that drives our models is based on the underlying metrics created by Dr. Andrew Coggan and TrainingPeaks, which include Intensity Factor® (IF®), Normalized Power® (NP®), Training Stress Score® (TSS®). As WKO4 has started to add new metrics and science into the fold, we have started to utilize these outside of the model to better hone our inputs to the model.
To start, we run some initial models around a Functional Threshold Power (FTP) for a standard Professional level cyclist to see the types of times we can expect on a course. Once we have an idea of about where we can expect a winning time, we look to the Power Duration curve in WKO4 to see what type of watts per kilogram (W/kg) a World Class rider could maintain for about that length of time. In the case of the Men’s time trial, we find that a World Class athlete can maintain around 5.89 W/Kg for around an hour and fifteen minutes.

This W/kg number assumes somewhat ideal conditions, so we take this number as a goal NP target when running models. Now that we have a goal W/Kg, we can multiply that by a riders weight to give an approximate NP target for a rider. Some riders will out perform these numbers, but it gives a good starting point to begin the analysis.
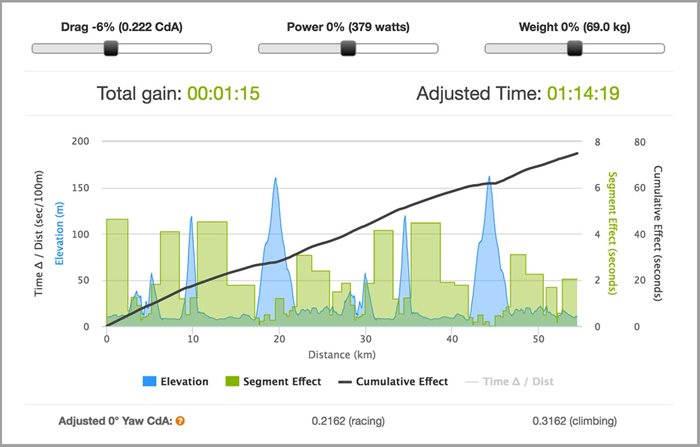
The other very large component of a prediction that is more difficult to fine tune is a rider’s aerodynamic drag, or CdA. We have spent quite a bit of time analyzing models and actually have a few models that more accurately estimates CdA based on previous performances. In reality though, so many teams are training position and going to the wind tunnel and velodrome that riders are starting to converge on levels where there is not too much difference between them. Top contenders will tend to have drag numbers between .215 and .23. That being said, using the Time Analysis tool in Best Bike Split, you can see that even that small a difference could mean over a minute of real time on the course, so finding the right mix of power generation and aerodynamics is the key for an ideal time trial.
In the Time Analysis image below, you see that lower drag can have a very large impact, especially in the flatter headwind sections. In the climbing sections it will almost always be about power to weight ratio.
With the four climbs on the route, it’s not a traditional time trial course so riders are going to have a higher Variability Index (VI) than a normal time trial. Typically, on a flat time trial you would want your Average Power to be roughly equal to your NP. This indicates a very steady ride, but the terrain on a course like this will not allow riders to keep that steady effort. For this reason the course favors riders who can put in good time trials but also climb and descend.
On paper it sets up very nicely for Chris Froome to try to repeat what Sir Bradley Wiggins accomplished in 2012. The other major contenders on a stage like this are coming off injuries, or like Vincenzo Nibali and Richie Porte have had to pull out due to injuries in the road race. If he is at the top of his game, Dutch rider Tom Dumoulin has a very good chance. Plus, Froome looked less than stellar in the road race, so there are could be chances for others to sneak in.
Summary
Distance: 54.5km
Estimated Winning Time: 1:14:40
