
The ability to analyze cadence is both a basic and critical aspect of training. Nearly all data available to coaches and cyclists is created by applying force to pedals over time. This can be used to investigate how athletes apply their physiologies, via their pedaling rate, to different types of efforts.
A great advantage of working in WKO4 is the ease of determining whether two variables have a discernable relationship. If we create a simple scatter chart, we get a visual illustration of any pattern, such as the one shown below. This type of chart is different from quadrant analysis, which plots circumferential pedal velocity against pedal force in Newtons. I’ll show data from a four-corner criterium and a cyclocross race to illustrate how the same athlete adapts in each of these scenarios.

Cadence versus power in a four-corner criterium.
Cadence in a Criterium
In the chart above, the large cluster of points over the 80 to 120rpm range shows that the athlete maintained higher cadences during the race. The points resting on the X axis all represent very low power, showing that he preferred to keep the legs turning over while not applying power to the pedals. Most points over 200 watts and below 80rpm are likely isolated pedal strokes rather than true accelerations. I confirmed with the athlete that he was coming out of some corners overgeared and shifted down after a single pedal stroke, unable to accelerate fast enough from a low cadence.

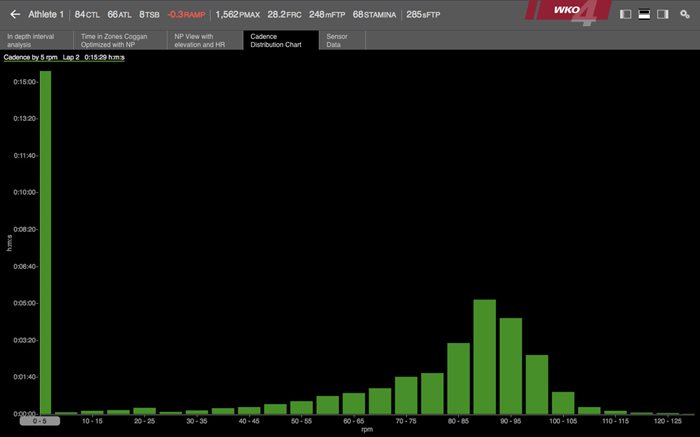
Criterium cadence distribution.
The bar graph above illustrates just how little time this athlete spent truly coasting. While I’m in the habit of encouraging riders to pedal as little as possible in races, by comparing the scatter chart to the bar graph, we can see there was usually little to no power going into the pedals during much of the low cadence pedaling.
Training Sessions
When training an athlete for a criterium, I can assign workouts with cadences that will represent the demands of his racing and create the metabolic outcomes I’m looking for. For instance, a common criterium preparation session might be 30 minutes of tempo at 80rpm, followed by varying recovery between 10 x 30 second Functional Reserve Capacity (FRC) intervals at 100 to 120rpm. The tempo effort is for glycogen depletion, because lower cadences are less aerobic than high cadences1. In this approach, more of the athlete’s FRC energy expenditure, and especially recovery, will be aerobic than if they were totally fresh. The tempo interval is also useful for this athlete because he needs consistent steady-state conditioning.
Why Energy Systems are Important to Understand
In order to understand this a little better, we should understand the energy systems in use. Glycolysis burns glucose from glycogen, which turns into acetyl-CoA, which is fed into the TCA cycle. Likewise, fats are turned into acetyl-CoA for the TCA cycle, which is aerobic metabolism that takes place in our mitochondria. In repeated maximal efforts shorter than about six seconds, the primary fuel used is phosphocreatine, which is regenerated via intermediates created by glycolysis (1,3-Bisphosphoglycerate), with another generated via glycolysis, as well as the TCA cycle (phosphoenolpyruvate).
However, when maximal efforts are extended to 30 seconds, after the first few, the majority of the fuel used from the sixth to thirtieth second is aerobically derived2. It’s worth noting that creating demand on one metabolic intermediate creates demand on all the intermediates leading to it, which always leads back to glucose and fat.

Cadence versus power in a cyclocross race.
Cadence in a Cyclocross Race
The above scatter chart shows the distribution for a cyclocross race. As you can see, it is quite unlike that of the criterium. The borders of the densest cluster are amorphous, showing a left skewed cadence distribution. Power output above cadences under 80rpm are consistently higher than in the criterium. There is frequently a large difference of entry and exit speed in cyclocross corners, and not every groupset is capable of dumping a chain all the way down a cassette, nor is it practical to shift a double chainring to the small ring out of every corner. This athlete appears to solve that problem by applying large amounts of torque out of corners.
Another noteworthy difference from the criterium is that the X axis looks a bit more bare, meaning the cross race was constantly either “on” or “off.” The single point at (0, 0) is probably hundreds of data points. To confirm what the scatter chart implies, we look at the bar graph for cadence distribution in this race.
Cyclocross cadence distribution.
We can see that much more time was spent coasting rather than spinning the legs without putting power to the pedals- over 15 minutes! This is to be expected in a cyclocross race with a lot of corners and obstacles requiring running.
The difference in this athlete’s steady-state cadence on and off road is apparent. Now that I know his habits, I can make sure his training on the road bike reflects his cyclocross racing. A sets of 15 to 20 second sprints with short rest periods is an old standby for ‘cross, but to ensure his training most accurately reflects racing, I can tell the athlete to slow down to 8 to 10mph and be a little overgeared, aiming to start pedaling at 55 to 75rpm.
Another important aspect of the lower cadence this athlete uses for cyclocross is that he’s burning through more glycogen stores. Sprinting from a low cadence requires muscle contractions that are longer and higher force, and this puts a premium on anaerobic energy sources, as well as high motor unit recruitment. To shore up anaerobic energy stores, FRC intervals should be included in all ‘cross training. The new iLevels calculated by WKO4 tell us this athlete’s FRC time range is 0:37-2:47 at 417-863 watts. While the athlete may never make a steady effort in a ‘cross race longer than a minute, the cadence analysis shows us that these highly anaerobic efforts require anaerobic conditioning.
These are a few of the insights that WKO4 can provide. Regardless of discipline, cadence analysis can inform coaches and athletes on how to create even more race-specific training to meet future goals.
