
How do you know if you are training too hard or not recovering adequately? This is one of the hardest things to get right as an athlete, but doing so will help improve your performance and decrease your risk of overuse injuries. Sometimes an adjustment to training is needed, but other times improved sleep and nutrition, for example, could be the ticket to achieving balance. Here are five signs you need to adjust your training load and recovery balance.
1. Impaired Feeling & Increased Perceived Exertion
TrainingPeaks allows you to rate each workout by feel and perceived exertion. Feel is measured with a range of smiley to frowny faces, and perceived exertion (RPE) is rated on a scale of one to ten. Comparing sessions is easy when looking at the calendar view on TrainingPeaks. For example, let’s say every Tuesday and Thursday you complete a 6- or 7-mile run in Zone 2 at the same pace and on the same route. For three weeks you rank these sessions with a feeling of a smiley face and a perceived exertion of a three. But during the fourth week, you rank these sessions with a frowny face and a perceived exertion of four. This is a red flag and would require further investigation about why you did not feel good on those workouts.
2. Post-Activity Comments
The post-activity comments in TrainingPeaks are a great opportunity to provide more subjective context to how the workout went, making them an important part of your training log. Using the same example from above, for the workouts with a frowny face and perceived exertion of four, you could write in the post-activity comments that you’ve been up against a work deadline and your legs felt flat on the run. This would be a sign that the bad feeling may likely be due to an increase in life stressors, as mental fatigue can negatively impact performance.
3. Flagged Metrics
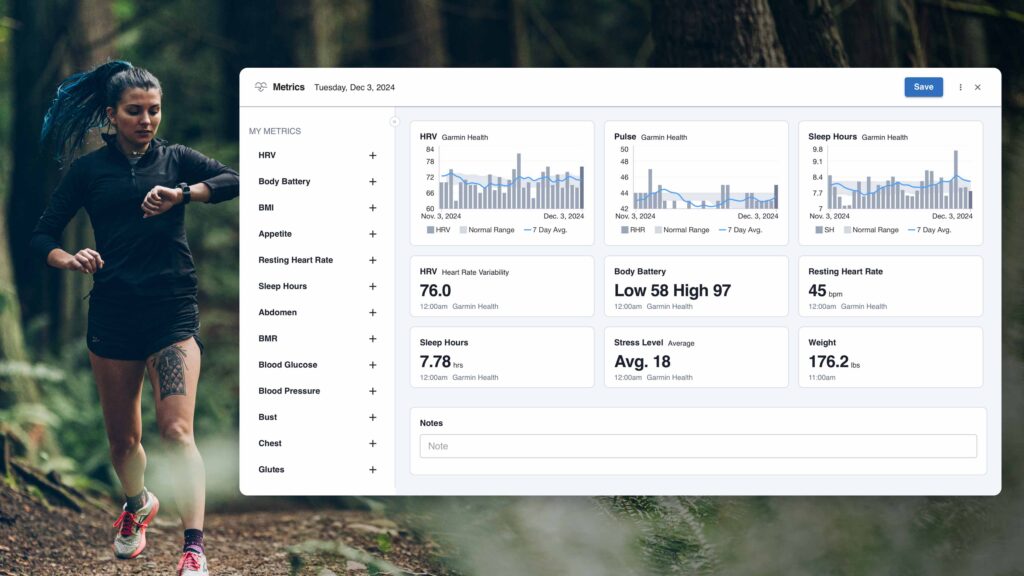
Inputting metrics on TrainingPeaks provides information about things like muscle soreness, stress, sleep, fatigue, sickness, and injury. When completed on a regular basis, these metrics provide great context to your training. For example, on days that you do not feel good during your workouts, your metrics may rank high for stress and fatigue and bad for sleep quality — these would be flagged in your TrainingPeaks app. Again, this provides context for when life stressors can negatively impact workouts. TrainingPeaks also allows you to export metrics into an excel document where you can further manipulate the data like calculating means, medians, standard deviations, and plotting graphs.
4. Poor Performance on a Quality Workout
Let’s say you perform a quality workout on a Wednesday of 5 x 3-minutes at 5-km race pace. You hit 5-km race pace for the first two intervals, but for repetitions 3-5, the pace drops to a 10-km race pace. In isolation, one workout with poor performance is not a major cause for concern. However, if you perform poorly for two or three consecutive workouts, that would be a red flag.
5. Change in Heart Rate
Red flags for heart rate include a higher resting heart rate*, a higher heart rate on a submaximal effort, or a lower heart rate for a near maximal effort. For the sake of brevity, we will focus on a higher heart rate on a submaximal effort.
There are a few important caveats when using heart rate to monitor training. Firstly, chest strap monitors provide better accuracy than wrist-based monitors. Secondly, when comparing heart rate between workouts, this is best done for sessions that are completed on the same route at a similar time of day and at the same running pace. You also need to consider weather conditions such as ambient temperature, wind speed, and humidity, all of which can influence heart rate. Finally, research suggests a minimum change of five to eight beats per minute at a submaximal effort would be required to be considered significant.
For example, if you do your easy Zone 2 runs on Tuesday and Thursday mornings before work, then your routine is probably similar from week to week. If, for example, your average heart rate is 145 bpm, a stressful week could increase your average heart rate to 155 bpm. The increased heart rate may indicate issues such as sickness, stress, fatigue, and/or dehydration. The exception to this is you may see a decreased submaximal heart rate after a large, short-term increase in training load such as an ultramarathon or training camp.
*Note: Metrics like HRV and RHR can be automatically synced to TrainingPeaks if you use a compatible device or app. Metrics Cards in TrainingPeaks Premium also chart this data over time, which makes it even easier to spot outliers. See compatible devices.
Take-Home Message
How these signs should be used to adjust your training load/recovery balance is unique to each athlete, and is dependent upon your own tolerances to training and life stressors. They provide useful data for athletes and coaches, and they are all relatively simple to track. When these signs are evaluated holistically, they can provide valuable information to discuss with your coach. The more information you provide in your TrainingPeaks account, the better you will be at monitoring and adjusting your training load.
References
Bellenger, C.R. et al. (2017, February 11). The effect of functional overreaching on parameters of autonomic heart rate regulation. Retrieved from https://pubmed.ncbi.nlm.nih.gov/28188371/
Johansson, R.E. (2020, February). Interactions between training load, submaximal heart rate, and performance in endurance runners. Retrieved from https://www.researchgate.net/publication/343615000_Interactions_between_training_load_submaximal_heart_rate_and_performance_in_endurance_runners
Lamberts, R.P. et al. (2004, August). Variation in heart rate during submaximal exercise: implications for monitoring training. Retrieved from https://pubmed.ncbi.nlm.nih.gov/15320683/
Marcora, S.M. et al. (2009, January 8). Mental fatigue impairs physical performance in humans. Retrieved from https://pubmed.ncbi.nlm.nih.gov/19131473/
Pasadyn, S.R. et al. (2019, August). Accuracy of commercially available heart rate monitors in athletes: a prospective study. Retrieved from https://www.ncbi.nlm.nih.gov/pmc/articles/PMC6732081/
Siegl, A. et al. (2017, July 13). Submaximal Markers of Fatigue and Overreaching; Implications for Monitoring Athletes. Retrieved from https://pubmed.ncbi.nlm.nih.gov/28704885/


