



Simon1 reports that he is struggling with training. As you read his workout comments, you quickly see the theme:
My muscles are just feeling so heavy and dead.
I can’t seem to produce the power or pace, but the RPE feels really high.
Then you review the data and notice irregularities in HR and pace, neither of which are lining up with his reported RPE. You see this disconnect in several workouts across the past week or so of training. The pattern indicates deeper-than-expected, lingering fatigue from the training you’ve scheduled. Does Simon need more recovery, or is he on the brink of overtraining?
Key TrainingPeaks metrics help us answer this question. With the right tools, we can help athletes like Simon before they are too far gone. In this article, I’ll review the concepts of overtraining and under-recovery, then explain a workflow to help diagnose what’s going on using three types of TrainingPeaks data.
Signs of overtraining vs. under-recovery
First, let’s be clear on our terms.
Overtraining results in an ongoing pattern of fatigue, underperformance, frequent illness, or burnout that occurs without other identifiable medical causes. Ultimately, an athlete approaches this state when the ratio of training load to rest gets really out of whack for an extended period of time. It typically takes months and possibly years to become truly overtrained.
However, athletes may still exhibit symptoms that look like overtraining because they are under-recovered and have entered a state of nonfunctional overreaching. In my experience, under-recovery is significantly more common than overtraining, especially among busy age-group athletes.
In programming, the coach’s goal is functional overreaching. We apply a progressive overload in the training stimulus. Of necessity, this creates short-term fatigue, but after a period of proper recovery, the athlete becomes fitter than they were previously. They’ve adapted. What’s “proper” recovery for each athlete will vary. There’s no static formula, and as coaches we need to account for the myriad of stressors that impact an athlete’s ability to recover: work stress, family responsibilities, life changes, disrupted sleep, poor fueling and nutrition, and the like.
For example, Simon’s training load has been manageable relative to his history. You haven’t programmed anything out of the ordinary for him. But work has recently shifted and added new stressors into the equation. He’s also reported some disrupted sleep from that stress. So Simon’s typical training load is likely not going to be absorbed the same way as it has in the past.
If Simon continues down this path for an extended period, what starts as under-recovery or nonfunctional overreaching can shift into true overtraining. Risks can escalate from a drop in performance to longer-term health risks like frequent illness, changes in hormones, sleep disturbances, mood disruption, and changes in HR rhythms. Excessive overtraining can push an athlete out of the game for months or even years in extreme cases.
A watchful coach, however, can use TrainingPeaks data to catch the onset of under-recovery early.
The TrainingPeaks data workflow to catch under-recovery early
By tracking three buckets of data, you can identify problematic trends before they become a real problem.
These include:
- Qualitative data: Athlete comments, RPE, and Subjective Feeling
- Training metrics: HR, power, and pace
- Recovery and fatigue metrics: HRV, RHR, sleep, and TSB
Combining these three categories is the most powerful way to identify any issues and implement a just-in-time training adjustment. Let’s go back to Simon’s data to see how this workflow operates in practice.
Start with the qualitative data
Athlete comments, RPE, and Feeling begin the workflow in any analysis I do. Before I even open the workout below, I notice two things: a higher-than-expected RPE and a “weak” Feeling rating.
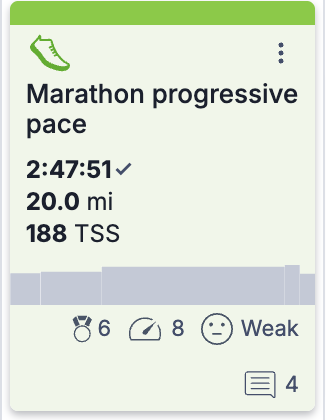
From there, I go to the comments. Simon explains that the run felt harder than expected, with tightness in his hips and glutes that worsened in the back half, and that the rolling terrain was a particular struggle. He adds that his HR seemed out of sync with his pacing.
Before I even look at the training data, I know some important details.
At this point, I’m developing a list of possible suspects, including:
- Fueling and hydration during this workout and in the days prior
- Sleep patterns in the past two to three days
- Temperature and conditions during the run
- Pacing discipline
But I still need more information, so from here, I go to the training metrics to get a further understanding of what is happening.
Analyze specific training data
With an understanding of Simon’s perspective of the workout, I head into Analyze 360. I’m particularly interested in the relationship between his input and output variables, specifically his heart rate and his pace.
Looking at the elevation chart, I notice the run starts right up a hill. This is not entirely atypical, though. Previously he’s been able to run comfortably uphill at 8:30 to 9:00/mile, but today this pacing led to a quick rise in his heart rate that he never really recovered from. This segment also shows a higher Pa:HR, evidence of decoupling. By itself Pa:HR (or Pw:HR) tells us the rate of cardiac drift, but it doesn’t fully explain why. It could be fatigue, fitness, dehydration, stress, or some combination of all of the above.
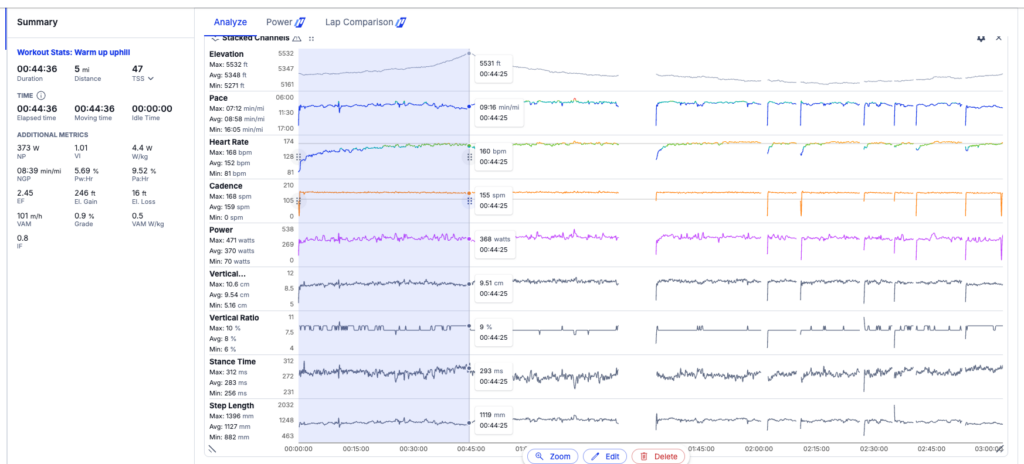
As he continued, his heart rate remained elevated, even as he slowed considerably in the final 30-45 minutes of the run. It could be that he started too hard. However, previous runs demonstrated this sort of pacing is within his ability. So the HR is telling me something about this effort on this day. But I need more details to determine what.
I break the run into four segments, then use lap comparison to understand the progression across the laps. The fourth lap, seen below, shows the slowdown most clearly.
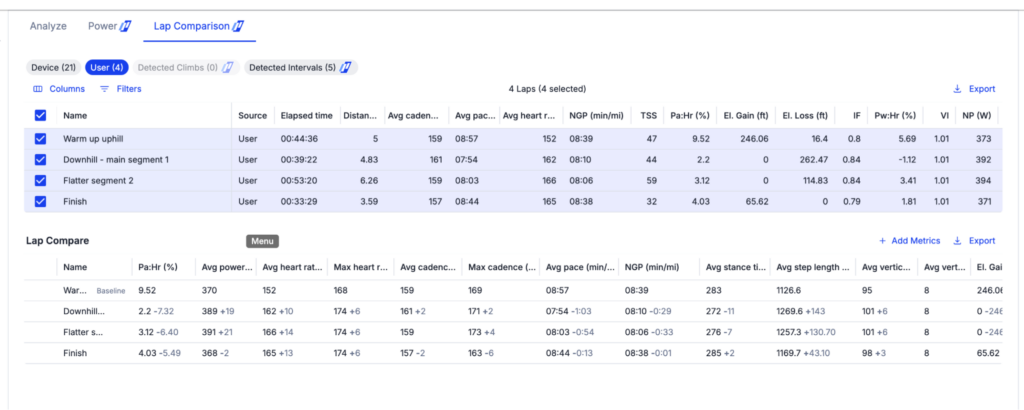
At this point, I ask a few more questions to help me understand why that opening effort led to a higher-than-expected HR response and why the back lap faded so much:
- What were the temperatures?
Simon reports it was only 75°F, about 20° cooler than the summer temps he had been training in. Hmmm. Okay, so heat wasn’t driving the heart rate up. - What was hydration and fueling like going into and during the workout?
Again, Simon notes his hydration during the workout was normal, as was his daily intake. While we can’t rule out dehydration, it doesn’t appear to be a factor based on his reported intake of fluid and his urination schedule. - Are there markers of fatigue earlier in the week, either through his subjective comments or in the data itself?
In both cases, I review the trends from the previous workouts. In the seven days prior, I see three other workouts for which Simon reported feeling “weak.” In one higher-intensity bike workout, he was unable to hit his targets and complete the workout. While he had two easier days following this bike, the run we’re looking at now tells us it wasn’t enough.
Based on all of the available information, it’s likely time for a bit more recovery for Simon. As I tell my athletes: A rest day in time can save nine.
But there is more information we can add to this picture. Three workouts with fatigue don’t necessarily add up to non-functional overreaching (yet), but they may indicate something about recovery, or the lack thereof.
Review recovery and fatigue metrics
Once an athlete flags ongoing symptoms of under-recovery or nonfunctional overreaching, especially in a patterned way, I turn to the recovery and fatigue metrics.
Sleep and heart rate patterns
When it comes to HRV, RHR, and sleep, one or two off days doesn’t necessarily signal an issue or the need to dial things back. But, if you look at the pattern, you may start to see some signs in the chart lines.
I use several key charts I’ve created in the TrainingPeaks dashboard that allow me to easily see the relationship between:
- HRV and RHR. If HRV starts dropping below baseline, while RHR starts rising above baseline, that is usually a sign that the athlete needs recovery. It’s also worth noting that an excessively high HRV can signal that something is amiss with the nervous system.
- HRV and Sleep. Here, I watch for sleep trends that may impact the athlete’s HRV. Typically, disruptions in sleep will cause changes in HRV, but not necessarily on the same day. Sometimes, HRV patterns shift a few days after poor sleep, especially if there are several days of poor sleep.
Let’s look at Simon’s charts. Below, you see a 90-day look back.
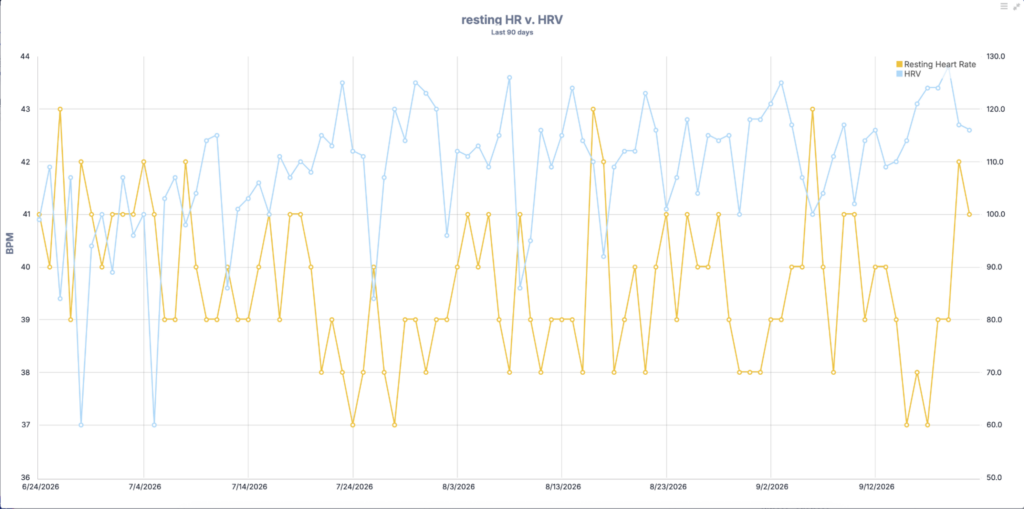
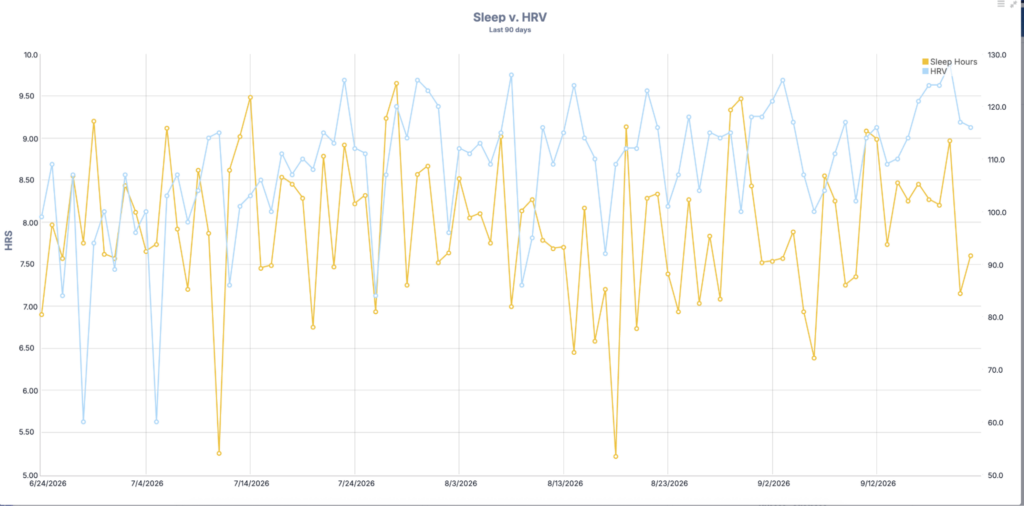
I notice that the night before the run, Simon had about one hour less sleep than usual, resulting in a slightly higher RHR and slightly lower HRV. From this, I surmise that disrupted sleep is more the issue here than training load. Without sleep, he isn’t recovering fully. Furthermore, I see a few days where his RHR and HRV fall outside of the baseline (either oddly high or low).
Training Stress Balance (TSB)
Another recovery metric I review is Training Stress Balance (TSB), which is the differential between the athlete’s Acute Training Load (ATL) and their Chronic Training Load (CTL). Generally speaking, we need TSB to be in the negative to achieve functional overreaching. However, if this number goes too far into the negative, the athlete may dig themselves a fatigue hole.
While the bottom may differ for athletes, -30 or so is about as far as most age group athletes can go before they need a deloading week.
Let’s see how Simon is doing on this score. On Monday, Simon clocked in with a -32. He had three workouts on Tuesday, Wednesday, and Saturday (the run above) where he reported higher than usual fatigue. This tells me that -32 may be too deep of a dip and we would be safer to not let that TSB drop below -25 or so, especially given the added work stressors.
Keeping track of how much load an athlete can handle will help you understand when it is time to introduce a deloading cycle. Prior to the new stressors at work, Simon had no issue with building three weeks before a deloading week, but we are learning that with his new work pressures, we may need to introduce that deloading week on the third week rather than the fourth. Other factors at play here include increasing overall TSS as he prepares for an Ironman triathlon. Simon may need more regular deloading weeks once the weekly TSS tops over 1000.
Use the data to keep their training on track
In this case, Simon isn’t overtrained. But the data indicates he’s not recovering fully from the training stimulus. Without intervention, he will enter a period of non-functional overreaching, which, left unchecked, could be a very serious problem. So the interventions in this case include a deloading week every three weeks instead of every four, ensuring his TSB doesn’t drop below -25, and adjusting the program when sleep is overly disrupted due to work. Should Simon continue to have issues, we could include back-to-back rest days.
Our athletes rely on us to improve performance, which sometimes means taking a step back. In a culture where more is too often confused as better, it can be hard to convince an athlete to do less.
Sharing this type of analysis with your athlete can help them see the patterns and understand how recovery becomes a central part of their training. It also ensures that Simon can continue to train for many years to come.
- Names have been changed. This example is based on a combination of common athlete experiences, and not a specific athlete. ↩︎


