
As a coach, I am always looking for more effective ways to individualize training. Power meters have not yet been used to their full potential in creating actionable data for long-term improvements in sprinting.
Fortunately, WKO4 is flexible enough that coaches and athletes can develop their own tools to better match the abilities of a rider to the demands of target events that require maximum power output.
In assessing endurance training through power files, we can track aerobic and metabolic fitness markers such as VO2max and FTP. However, if we take a similar approach with peak power, we can’t rely on power data alone.
In order to understand the limiters of sprinting to create effective training plans, we have to understand how we achieve maximum power by looking at its components: torque and cadence.
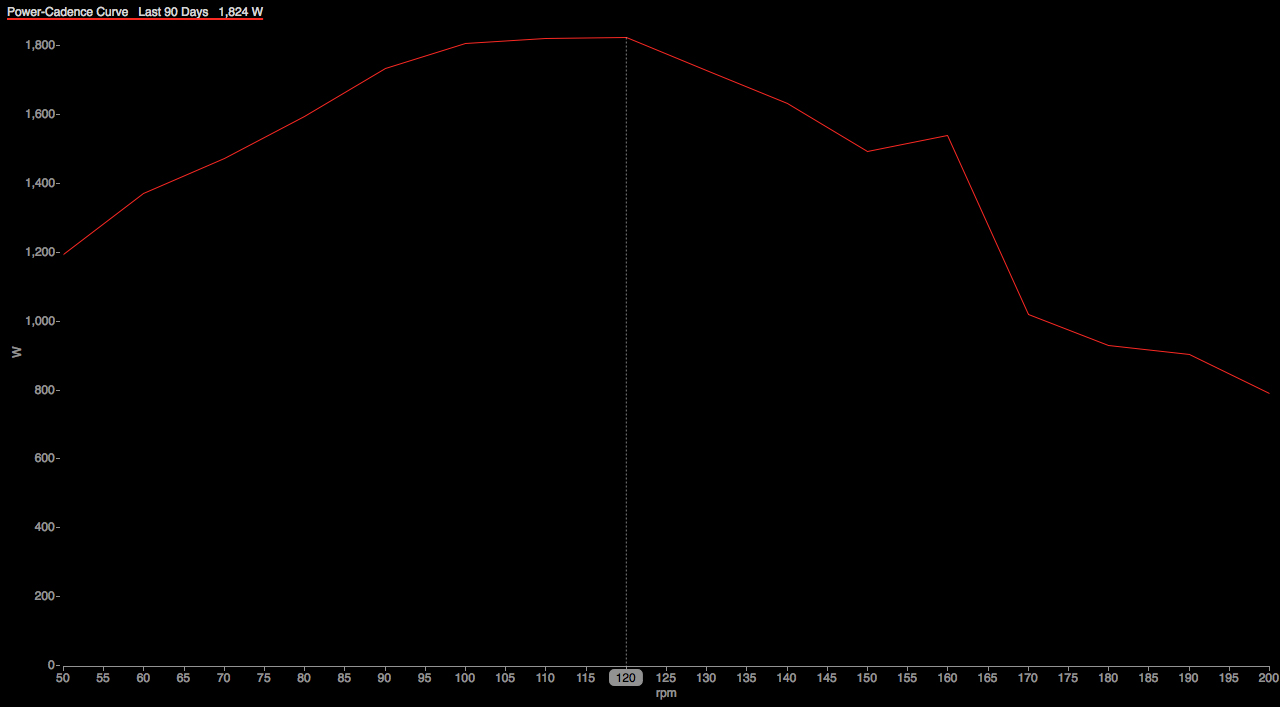
Each athlete has a range of optimal cadence for the best sprint performance. We can see this by graphing an athlete’s peak power for a range of cadences.
In the chart below, cadence is reported every 10 rpm but includes data +/- 5 rpm, which is sufficient for most cycling disciplines except perhaps track sprinting.
Therefore the 120-rpm point is the peak power achieved for 115-125 rpm. This particular athlete is capable of producing close to his peak power between 95 and 125 rpm.
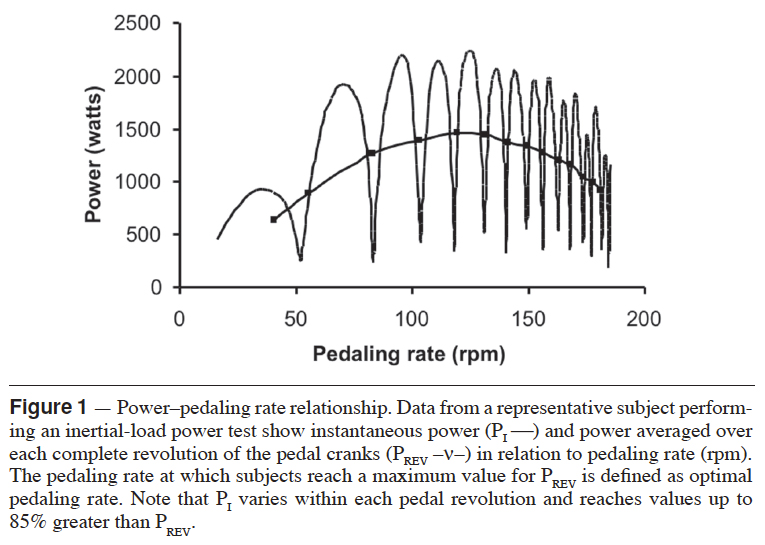
The pedal stroke is another important tool in understanding how power develops. Power and force do not turn on and off like a light switch, but develop with time. While sprinting, within half a pedal stroke (one leg covering 12 o’clock to 6 o’clock), power and force reach their peaks about when the cranks are generally level to the ground and then drop off again to near zero. This is illustrated in the graphic below from Pardyjak et al 1.
The final component of understanding sprint performance is recognizing that force applied to the pedals is limited by maximum strength. However, strength improvements are velocity specific2.
Given that heavy lifting occurs at rather slow contraction speeds compared to sprinting, athletes who are only good at lifting heavy weights may not be good sprinters, because they lack sufficient rate of force development (RFD, how quickly force develops during the pedal stroke).
Our takeaway here is that it’s not only important how much force an athlete can apply, but how fast the force develops over time. RFD is the velocity limiter.
How fast do athletes need to develop force while sprinting? At 120 rpm, the time between the lowest and highest pedal force is about 0.125 seconds (from about 12 o’clock to 3 o’clock). Once an athlete maximizes RFD in this time range, maximum strength is the limiter, and then we’re back to how much force the athlete can apply. Endurance coaches will see a similarity with the interplay between FTP and VO2max.
Most power meter recording happens at one-second intervals that do not capture the nuance of RFD during each pedal stroke. Fortunately, WKO4 is flexible enough that we can still see how fast an athlete can develop power at sprinting cadences.
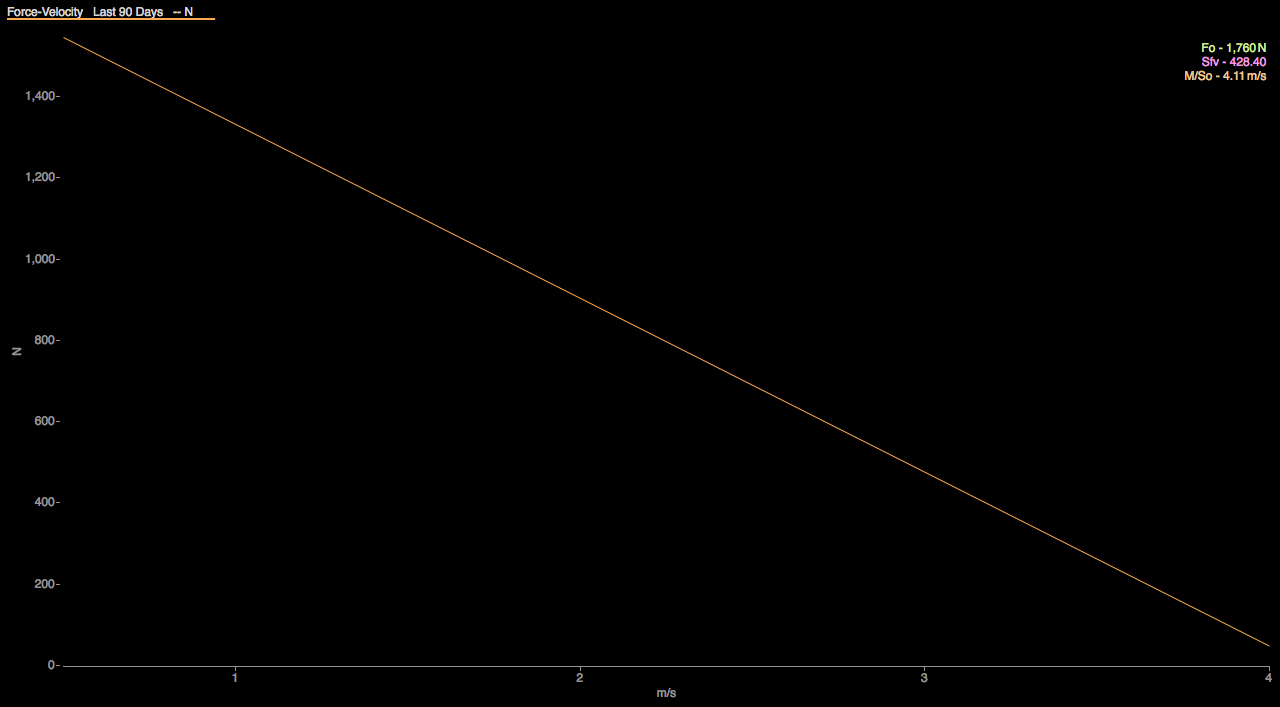
The force-velocity curve is my main tool to assess whether a sprinter’s main limiter is strength or speed. Since power is force x velocity (in units, W=N(m/s)), we can graph pedal force in Newtons (AEPF, average effective pedal force) against pedal speed in m/s (CPV, circumferential pedal velocity).
Reported with the curve are the x-intercept (m/so), y-intercept (Fo), and slope of the force-velocity curve (Sfv). These are not meant to be predictive but to be used to compare performances over time. For instance, when an athlete’s RFD increases, so does m/so while Fo remains about static, because force at higher cadences will increase, raising the value of the x-intercept.
Below are a sprinter’s force-velocity curves for the baseline (summer road season), strength base (fall), and strength-speed build (winter) periods.
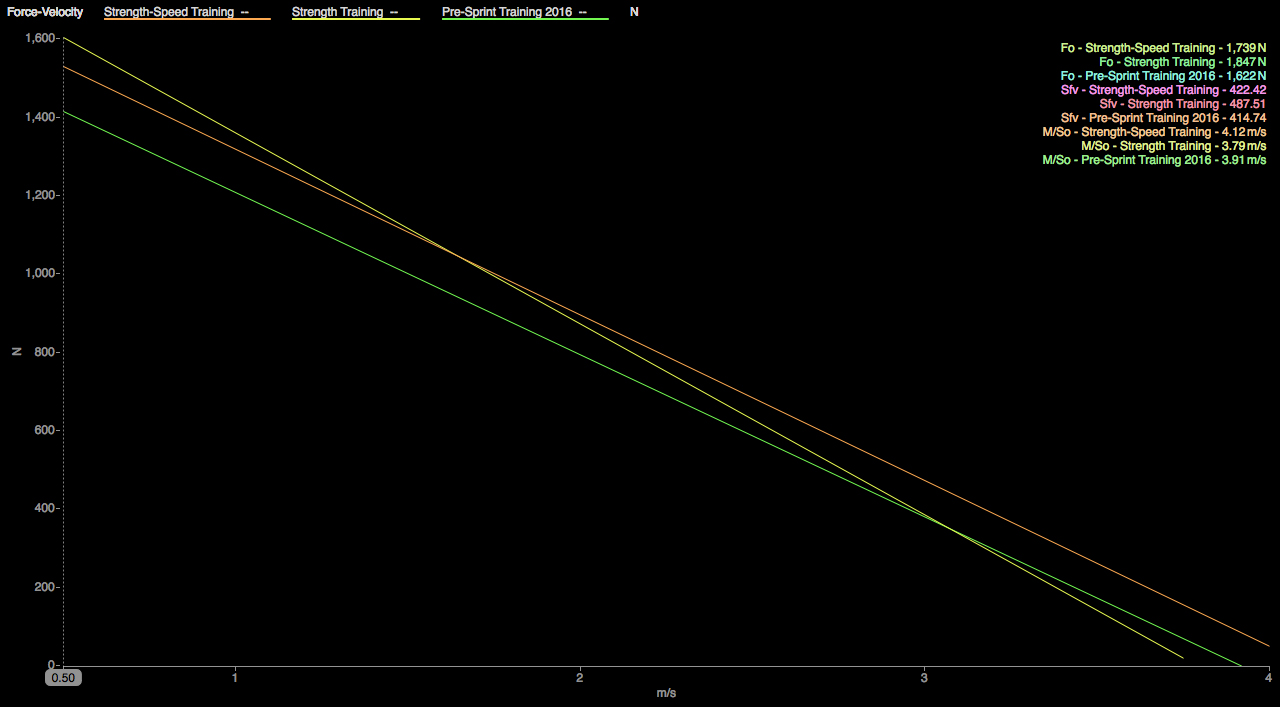
We see during the strength base period that force at low pedal velocity (<1.25 m/s) increases. This is because adaptations to strength training are specific to muscle contraction velocity, which we see as cadence or CPV. Heavy-lifting velocities are well under 1 m/s, so one would not expect more than a modest increase, if any, at higher velocities.
The inclusion of high-velocity work both in the gym and on the bike leads to an increase in the force-velocity curve, resulting in a slope similar to pre-training. To see this periodization directly as power, we can look at the power-cadence curve shown previously.

During the base and build periods, power in the 120 rpm range (remember the graph actually shows 115-125 rpm) increased only about 50 watts, while power at low cadences increased dramatically, particularly in the 50-60 rpm range, a leg speed similar to heavy lifting.
The addition of speed training to raise the athlete’s RFD increased power at 120 rpm by about 220 watts. There were no increases of strength during this period.
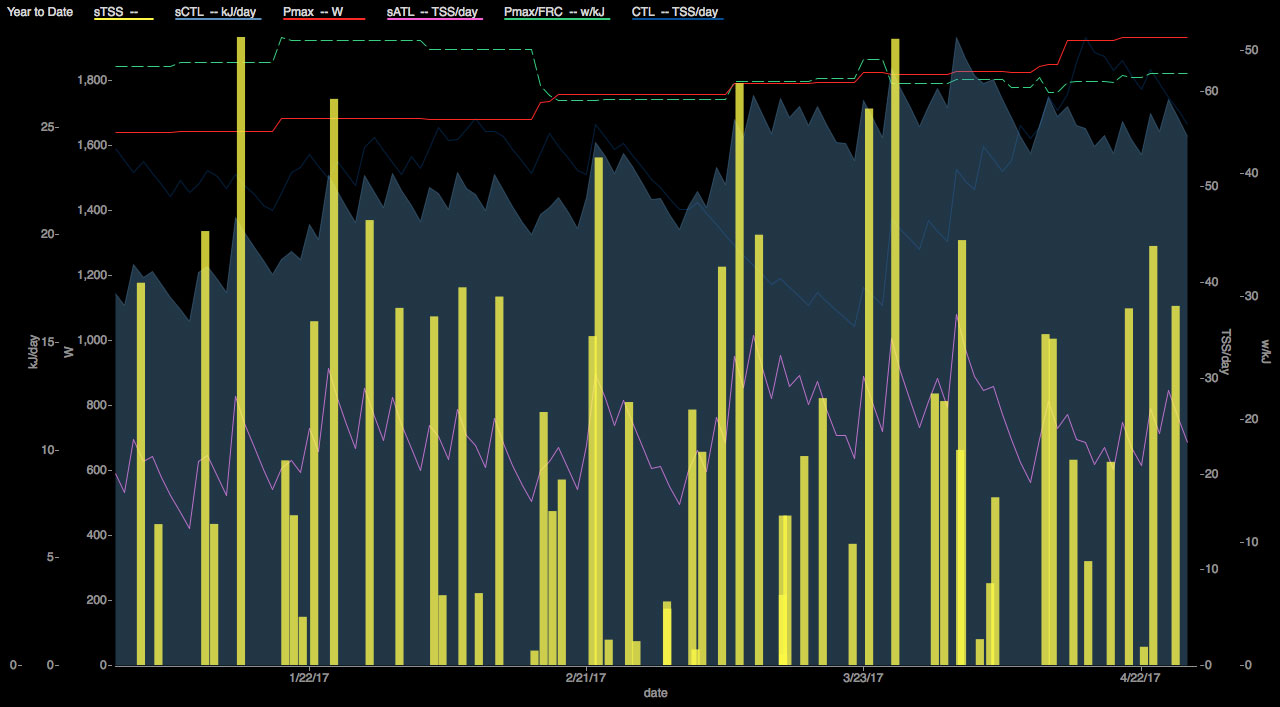
To track sprint training load over time and to see the minimum work required to increase or maintain Pmax, I created the following chart to see the kilojoules burned in Coggan’s iLevels Pmax and Pmax/FRC. I call this sprint TSS, or sTSS.
Additionally, there are sCTL and sATL, which act like the familiar CTL and ATL values used to track overall training load, but the constants are adjusted to reflect appropriate periods of adaptation and recovery. Comparing these with Pmax, we can follow trends like we would when comparing CTL and FTP.
(Special thanks to William Renfroe for his help in writing the expressions used in these charts.)

