
When the season’s last race has been run, it’s time for coaches to review what was in order to determine what can be in the future. While our athletes may train less in the postseason months, our work as coaches is not done.
Postseason provides the time to review our athlete’s training and racing successes and failures — as well as our own strengths and areas of opportunity as coaches. If you have athletes that might otherwise drop off your roster at the end of the season, the postseason review may give them the incentive to stick with coaching.
This article outlines the process I conduct for our yearly athletes at the end of each season, constituting 83% of our athlete list at No Limits Endurance Coaching. This includes:
- Athlete reflection
- Data review of races and key training
- Review of subjective factors
- Phone/Zoom review with the athlete
Reflection & Planning
At the end of the season, I send my athletes a reflection and planning document. This document includes prompts to reflect on the current season and to plan for the future. This document forms the cornerstone of review and planning for the coming season.
Examples of questions I ask include:
- What was your key achievement from this year?
- What did you learn, and how will you use these lessons to build into the coming year?
- What do you wish would have been different this year?
- What did I do well as your coach, and what should I keep doing? What should I stop doing?
- What are your responsibilities as a coached athlete? How well did you meet those responsibilities this season?
The answers to these questions begin the review process. Combine this information with your quantitative and qualitative metrics review to discuss with your athlete as you prepare for the coming season.
Race Review
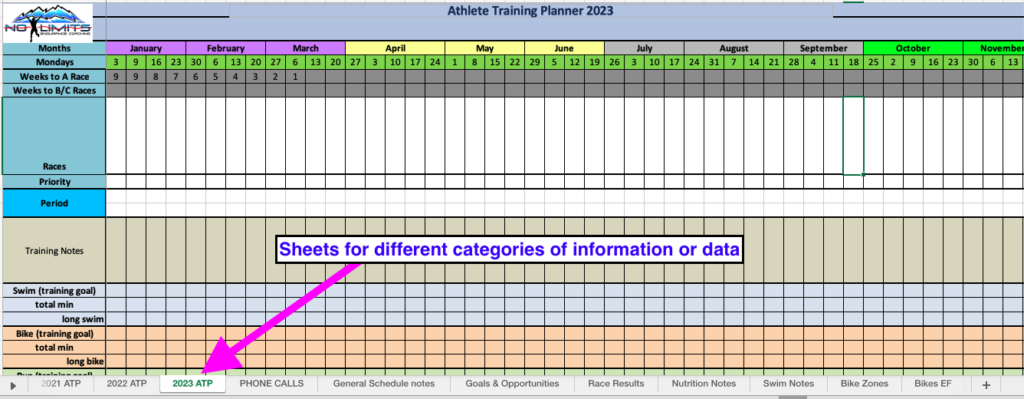
I keep a single excel file for each of my athletes. This file has a series of sheets for:
- ATP (a different ATP sheet for each year I work with the athlete)
- Goals
- Schedule Notes
- Race Results
- Swim, bike & run data points & notes
- Training zones and thresholds
- Fueling, Hydration
- Notes from correspondence
As my athletes complete the reflection and planning documents, I use this file and TrainingPeaks and WKO data charts to conduct a performance trend analysis. Zooming the focus out to see the broader patterns is instructive to help determine what to work on in the coming year.
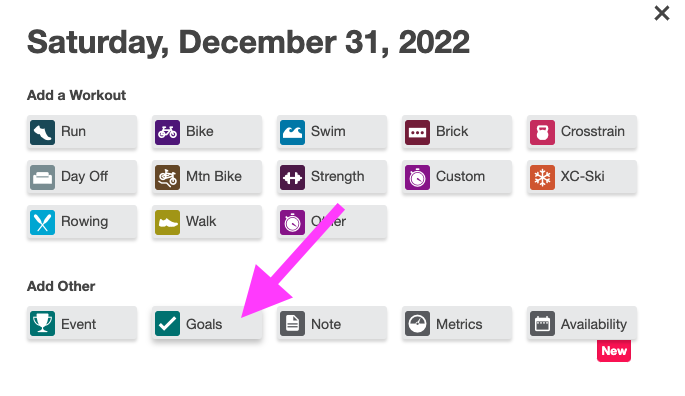
My analysis returns to the goals the athlete set at the start of the year. I store these in the ATP file for each athlete. You can keep track of goals using the “Goal” feature in TrainingPeaks. This is great for creating accountability for your athlete.

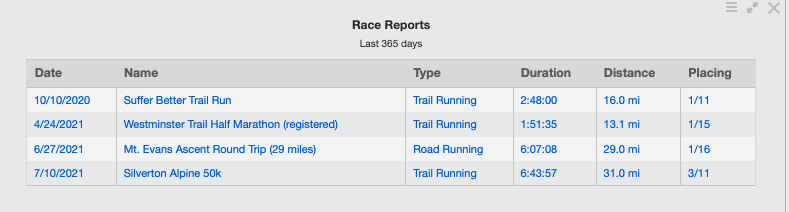
Next, I review the athlete’s basic outcomes, comparing them to the goals set. TrainingPeaks offers a race report chart with overall time, segment times (for multi-sport or stage events), and placement. It is useful to keep this information updated throughout the year.
I also keep track of this information in the athlete’s file, with a sheet that includes specific data relative to each race, such as speed, power and the like. See the image below for an example of triathlon runs and rides that I tracked from 2021 and 2022. In this format, I can review the current and previous seasons.
Triathlon Running Chart Example
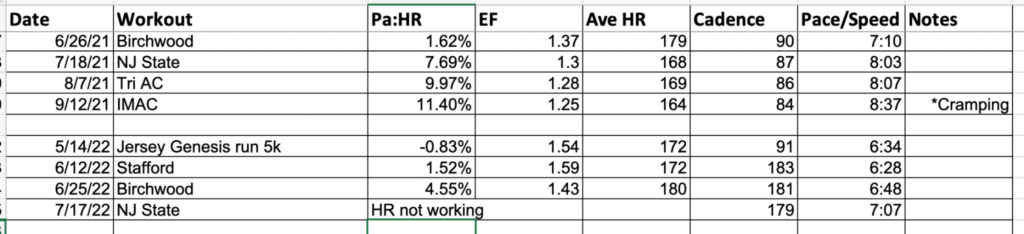
Triathlon Cycling Chart Example

I look for patterns in performance and ability, such as the athlete’s racing tendencies and race reports. For example, do they tend to fly and die in their pacing? Or do they underperform relative to training output? Do they nail or fail on their fueling and hydration? Does the athlete do well or poorly in certain conditions and terrain? This is only a portion of the types of things I review. For a more complete list, I’ve written previously about how to do a post-race analysis, which you can find here.
As I conduct this review, I take notes on the trends I observe, which form part of the year-end phone/zoom review the athlete and I will have.
Comprehensive Training Review
Equally valuable to year-end assessment is a review of the training data, looking for patterns in training load and consistency.
Training Load: PMC, CTL and TSS
The performance management chart (PMC) shows the athlete’s overall training load and consistency. I want to see a gradual growth in the chronic training load (CTL). The blue line is CTL.
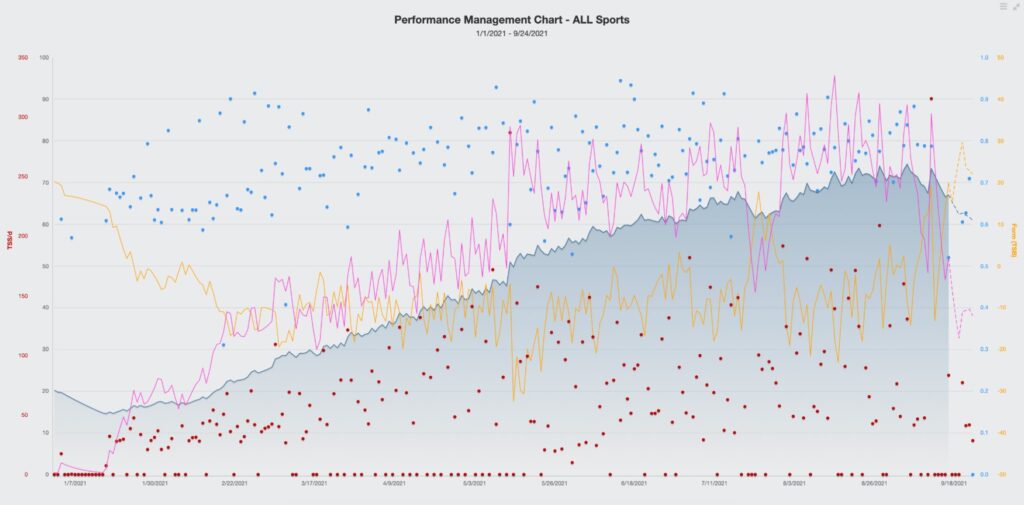
Conversely, you can look for opportunities to improve an athlete without a similarly gradual or consistent rise in CTL.

From the PMC, determine the athlete’s peak CTL in order to plan for CTL targets in the coming season or how long it might take to reach an appropriate training load for future goals. For example, let’s say an athlete hit a peak CTL of 35 this season, and they want to complete an Ironman. You can then calculate the time it would take for them to reach a CTL safe for an Ironman’s completion. Generally speaking, I like to see an athlete hit a minimum CTL of 80 to complete an Ironman. If they want to compete, that number needs to be higher. (Can you find exceptions to this? Absolutely. So, know your athlete intimately as an N of 1.)
For an article that discusses target CTLs, see the post on planning the season with TSS and the help article on suggested weekly TSS and Target CTL.
The peak low points in the athlete’s Training Stress Balance (yellow line on the chart) can also be instructive to figure out how low that number can go before your athlete needs deeper recovery. For example, I have some athletes that can go to -30 TSB but others who need rest at -20.
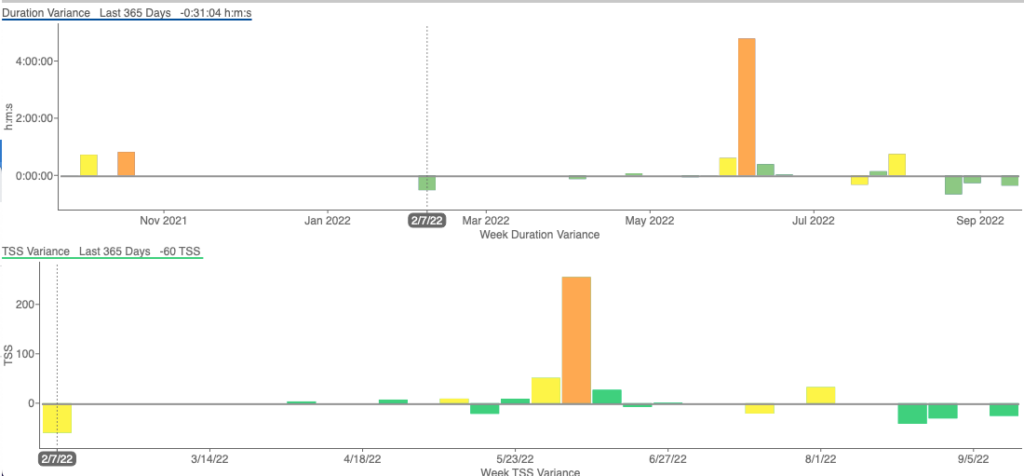
Beyond the PMC, analyze the athlete’s weekly and peak training load with the following charts:
- TSS by Week
- Duration by Week
- Longest Workout
These charts can be configured to include one or more sports.

With a sense of the total yearly training load measured by TSS or volume, you can make decisions about future training loads. This information is also helpful in explaining to the athlete what worked to achieve goals and what didn’t.
For example, let’s say you had a goal to build the athlete to a CTL of 100, but they only reached 80. From here, talk with the athlete about factors that prevented reaching the training load, reviewing what is in the athlete’s control. You could also discuss time management strategies if they missed training due to poor planning. That is beyond the athlete’s control.
Consistency
Check their consistency by reviewing what the athlete completed versus what you planned with the Fitness Summary chart. Hover over any specific training areas to get a summary of what was planned versus completed, as seen in this chart.

I focus on planned versus completed distance for swims, given that times may vary for various reasons. Here, this athlete was prescribed 230,574 yards, and they topped 239,781. Well done!
If you use WKO, you can further gauge yearly compliance for duration and TSS (training stress score) with the weekly compliance chart. A guide to the color coding means green is compliance within +/-20%, yellow is 50-79% or 121-150% of Planned and orange is less than 50% +/- Planned. This chart can be configured with percentage ranges of your choosing.
Examining Peaks
Next up, review critical peaks in the athlete’s performances – and the timing of those peaks. If the athlete’s peak performances align with key races, then you can applaud yourself on a well-periodized plan and the athlete can be congratulated on excellent execution.
But, if it appears that an athlete peaked before their prime (or never actually reached a peak), you can investigate why that might be so. Be sure to interrogate the athlete’s practices and your own programming. What can be improved or tweaked for the future?
TrainingPeaks or WKO Charts that work great for this purpose include:
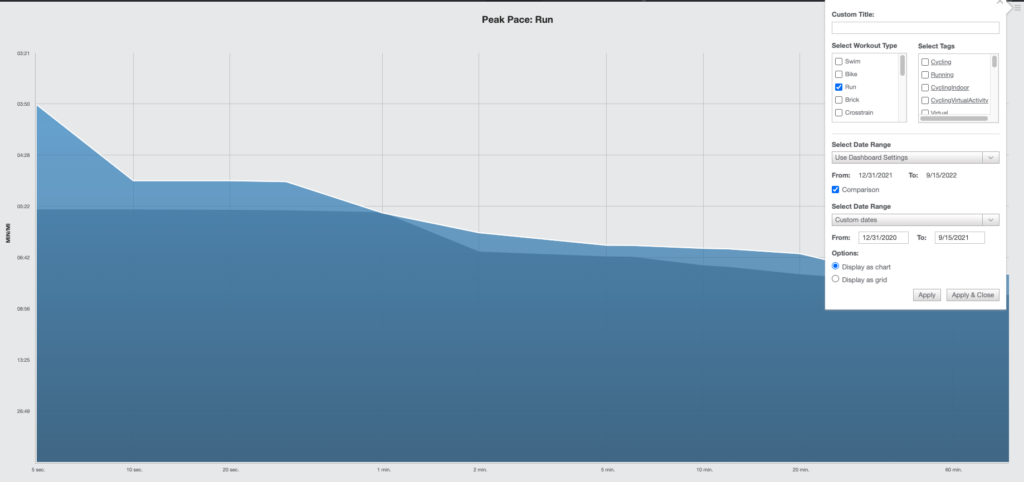
Peak pace or power
You can review this chart relative to a specific distance or period or make comparisons across two different time periods. See the image below, which is an example of Peak Pace. All are customizable by sport and period.
Fitness History
Get a month-to-month review of peaks by distance or duration over 12 months: review heart rate, power, cadence, speed, pace or pace by distance. As you see in the image below, you can select by sport and then the comparison variable.

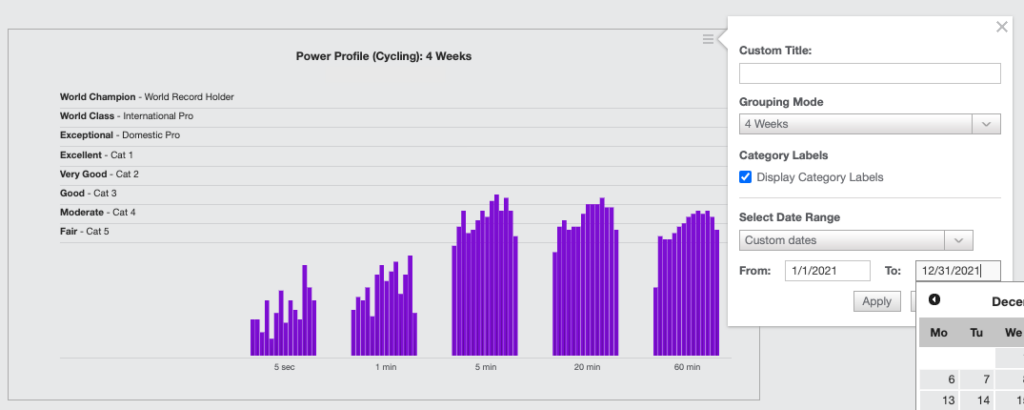
Power Profile
The power profile chart uses watts per kilogram to demonstrate an athlete’s power peaks across distances and compared to ranked cyclists. This chart exhibits growth using one-week, four-week or eight-week blocks. See the image below.
This example shows how this athlete built their power across the ranges throughout the season, working to a peak around a late-season race.
Subjective Assessments
Not all improvements can be easily measured in numbers. So, as coaches, we must reflect on how our athletes found growth. For example, did they work hard on open water swim anxiety, bike handling skills, learning how to run on technical trails, or fueling and hydration?
The reflection document can be helpful for this part of the analysis, as can re-reading post-activity comments on key sessions, race reports and your notes.
With this information, determine the key points you want to share with your athlete. Set up a meeting to discuss their postseason analysis to celebrate the season that was, as well as the foundation for the season to be. Provide support, kudos, and accountability that will allow your athlete to find the next level in the coming season.


