
Over the 10+ years I’ve been working with heart rate variability (HRV), I’ve lost count of the number of times I’ve been asked whether an athlete user’s HRV number is good, and if not, what does good look like?
What you need to know about HRV
Before attempting to give any numbers that athletes and those interested in improving their fitness can use for comparison, we need to address two questions:
- What is your personal situation? How old are you, what sex are you, are you a competitive athlete, age group/weekend warrior, an active person or someone who has been sedentary and is trying to improve their health?
- Why does your HRV number matter anyway, and what is it that you’re trying to achieve by tracking HRV trends?
For the first point, in order to determine whether your HRV is good, normal or bad, you need to be compared to a group of people of the same sex, similar age and training status. This is because average/normal levels of HRV vary by a factor of 10:1 or more depending on the group you are comparing to.
To answer the second point, the two key reasons you should care about your HRV number are:
- Changes in the HRV baseline (a rolling average of daily measures) correlate with changes in athletic performance and may even predict future performance changes following a training block (Buchheit et al., 2009 and Flatt & Esco, 2015)
- HRV baseline numbers tell a story about your prospects for healthy longevity. HRV measures the activity of the parasympathetic branch of the autonomic (unconscious) nervous system (ANS), which decreases during aging, and dysfunction of the ANS underlies cardiovascular and other age-related inflammatory diseases, such as type 2 diabetes (Jandackova et al. 2019) which is why it is such a great indicator of health.
*Note: If you regularly wear a heart rate monitoring device such as a Garmin watch, you can automatically import your HRV data into TrainingPeaks on a daily basis (see compatible devices). If you have Premium, navigate to your TrainingPeaks calendar on the web app and click on a “Metric” card to visualize how your HRV has changed over time.

How is your chosen app measuring HRV?
An important aspect to bear in mind when comparing HRV numbers from different apps or devices is that they depend on which HRV measure is being used and how it is taken.
Most HRV apps and wearables use a measure called RMSSD, which is a simple measure of high-frequency HRV — the kind most related to parasympathetic nervous system activity.
Some devices report the raw unit. Healthy individuals will have scores of 60-70 (depending on age), and top endurance athletes can have numbers of 90-100 (or even higher). Conversely, less healthy people will have numbers in the 40-55 range, and anything below that indicates a low level of vagal activity, which may be a cause for concern.
In what position and at what time of day is the measurement being taken?
Most people take their measurements first thing in the morning, sitting upright, whilst others prefer to stand, as they have found that position more sensitive to day-to-day changes with training and other stressors. Lying down or nighttime measures are not suitable for athletes since an effect known as parasympathetic saturation greatly reduces the sensitivity of the measure to changes (take a look at the chart of nighttime HRV from your favorite wearable if you don’t believe me!). The most important thing to remember is consistency. Try to take your reading at the same time each day and in the same position.
What is the average HRV for my age, sex and fitness?
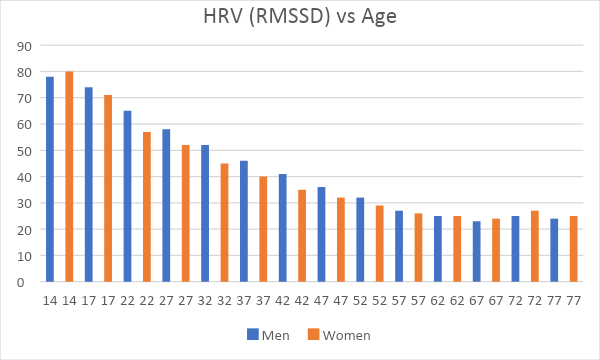
With that background set, now let’s get to the numbers. The most comprehensive survey of the general population that I’m aware of comes from a 2019 study of over 150,000 people in the Netherlands (Tegegne et al. 2020) and includes both HRV (RMSSD) and resting heart rate (RHR). The charts below show the HRV numbers themselves, which decline in an exponential manner from around 80 milliseconds (ms) for teenagers to 25ms for those over 75 years.
The equivalent chart using the log scale is shown below – you can see there is a more linear decrease with age up to the late 60s, after which HRV stabilizes in later life. This linear behavior, when log-transformed, is typical also of changes experienced by an individual on a day-to-day basis due to changes created by training and lifestyle.

Both charts show that HRV numbers for men and women are pretty much equivalent.
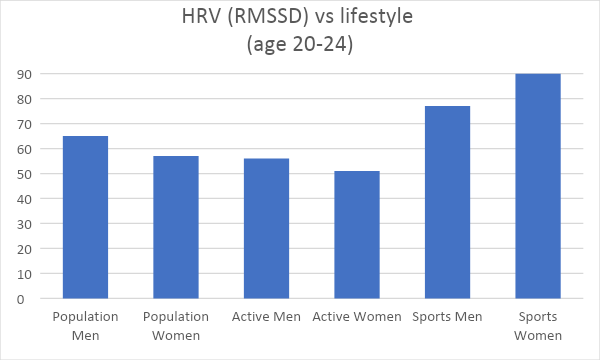
So, if these are representative averages for a broad population, what about sportsmen and women? A study in 2012 enrolled 200 subjects aged 18-24 who either took part in competitive sports or who had an active lifestyle but were not competitive.
The chart below shows comparable numbers between active men and women to the general population as you would expect, whereas those for sportsmen and women are considerably higher (20% and 60% respectively).

HRV for Masters Athletes
Another recent study (Deus, 2019) looked at small groups of Masters athletes (endurance and sprint) vs. both age-matched sedentary people and 25-year-old healthy but not athletic subjects.
An interesting conclusion from this one is that although the Masters athletes had an average age of 51 years, their HRV was as high as that of active 25-year-olds and much higher than that of similarly aged controls that were healthy but not athletic. Further evidence that lifelong physical activity can really help set back the age clock.

Best Practice and Getting Started
To find out more about the benefits of training with HRV, go to start with this article.
It is important to bear in mind that a bit like body weight, HRV changes from day to day, and changes of 10% one way or the other are not unusual. Also, like body weight, the underlying trend matters, and a baseline calculated as a weekly seven-day rolling average will reveal these. When training, recovery and lifestyle are well matched, it’s remarkable how stable your HRV baseline becomes. Good HRV apps and software will measure the day-to-day variation and identify when daily changes become significant — often by color-coding the variation against the standard deviation.
For best practice, here is a checklist to help you get the most out of HRV monitoring:
- Readings taken at the same time every day (ideally just after waking)
- Use a validated sensor & app
- Keep to the same body position (standing for elite athletes, otherwise sitting)
- Follow paced breathing (7-10 Br/min for athletes) (Why is this important?)
- Take at least 4-5 measures per week
- Record wellness scores & comments to provide context
- Check trends in the baseline as well as daily readings/color codes
- Don’t take measurements on race day
Why not give it a go and see how your HRV measures up and if you can get your HRV trending up above the ‘norms’ discussed above?

Improved TrainingPeaks Metrics Card
When viewing your calendar, click on the metrics card to view all completed metrics from that day and compare your Garmin (more device connections coming soon) values over the last 30 days. These graphs make it simple to track your HRV to help guide your training and understand your current health.
Visit this Help Center article to learn more about how to set up and use the metrics card. *The Metrics card is a Premium subscription feature; upgrade or renew here.
References
- Buchheit, M. et al. (2009, Dec. 22). Monitoring endurance running performance using cardiac parasympathetic function. Retrieved from Springer Link
- Flatt, A. & Esco, M. (2015, June). Evaluating individual training adaptation with smartphone-derived heart rate variability in a collegiate female soccer team. Retrieved from ResearchGate
- Jandackova, V. K. et al. (2019, Sept. 24). Healthy Lifestyle and Cardiac Vagal Modulation Over 10 Years: Whitehall II Cohort Study. Retrieved from PubMed
- Tegegne, B. S. et al. (2020, Dec. 1). Reference values of heart rate variability from 10-second resting electrocardiograms: the Lifelines Cohort Study. Retrieved from PubMed
- Deus, L. A. et al. (2019, June 1). Heart rate variability in middle-aged sprint and endurance athletes. Retrieved from PubMed


