
A combination of variables comes into play when planning workouts. Sport type, how often, how long, and how hard to push are all important considerations. It can all get a little overwhelming, especially if it’s your first time building a training block.
The three biggest factors to consider are frequency, duration, and intensity. Frequency and duration are easy to measure, but intensity can get a little tricky. Some people measure it by comparing performance to physiological metrics, like max heart rate or VO2 max. Others focus on specific performance markers where the body must respond in certain ways, like functional threshold power or the lactate threshold.
One great way to measure intensity is by using a scale called perceived exertion (PE). Understanding and using PE provides powerful insights that help you fine-tune future workouts and guide your overall training.
The Value of Perceived Effort
As a coach, I prioritize the integration of PE scores in my weekly training plans. Each session or interval within these plans is accompanied by an anticipated PE score. This approach fosters a proactive engagement with my athletes, encouraging them to share their post-workout PE scores and provide any associated comments. By actively seeking this feedback, I gain valuable insights into my athletes’ training experiences and how they align with the expected PE scores.
When disparities emerge between the projected and reported PE scores, it triggers a collaborative investigation. Our focus shifts to identifying the root causes behind the differences. Is the issue related to workout intensity, recovery, or perhaps external factors influencing their perceived effort? Through this thorough exploration, you can make informed adjustments to the training regimen, ensuring it remains tailored to individual requirements.
Perceived effort is an effective approach for coaches and athletes who prefer not to constantly fixate on their devices. Maintaining a constant gaze on a device screen while exercising isn’t realistic or safe. The mind, however, functions as a potent processor capable of comprehending and interpreting an array of input signals.
The recent time trial achievement of Jonas Vingegaard, triumphant in the 2023 Tour de France, stands as a compelling illustration of a professional tour athlete leveraging his training expertise to attain an exceptional performance. He adeptly navigated without being overly dependent on the numerical data displayed on his bike computer, instead channeling his effort through his perceived exertion (RPE).

The Difference Between the Borg RPE Scale and Borg CR10 Scale
The two most widely used PE scales were developed by Gunnar Borg a few decades ago. One is the Borg RPE scale, with scores ranging from 6 to 20, and the other is the Borg CR10 Scale, with scores of 0 to 10.
Borg RPE Scale
The Borg RPE Scale was developed by Swedish researcher Gunnar Borg in 1962 as a way for athletes to measure intensity during their workouts. At that time, personal HR straps or smartwatches weren’t widely available, so the scale was based on a high linear correlation between the ratings of perceived exertion and HR (r = 0.85), with the work intensity varying from light to heavy. This scale ranged from 6 to 20, with 6 being no effort at all, and 20 being maximal effort.
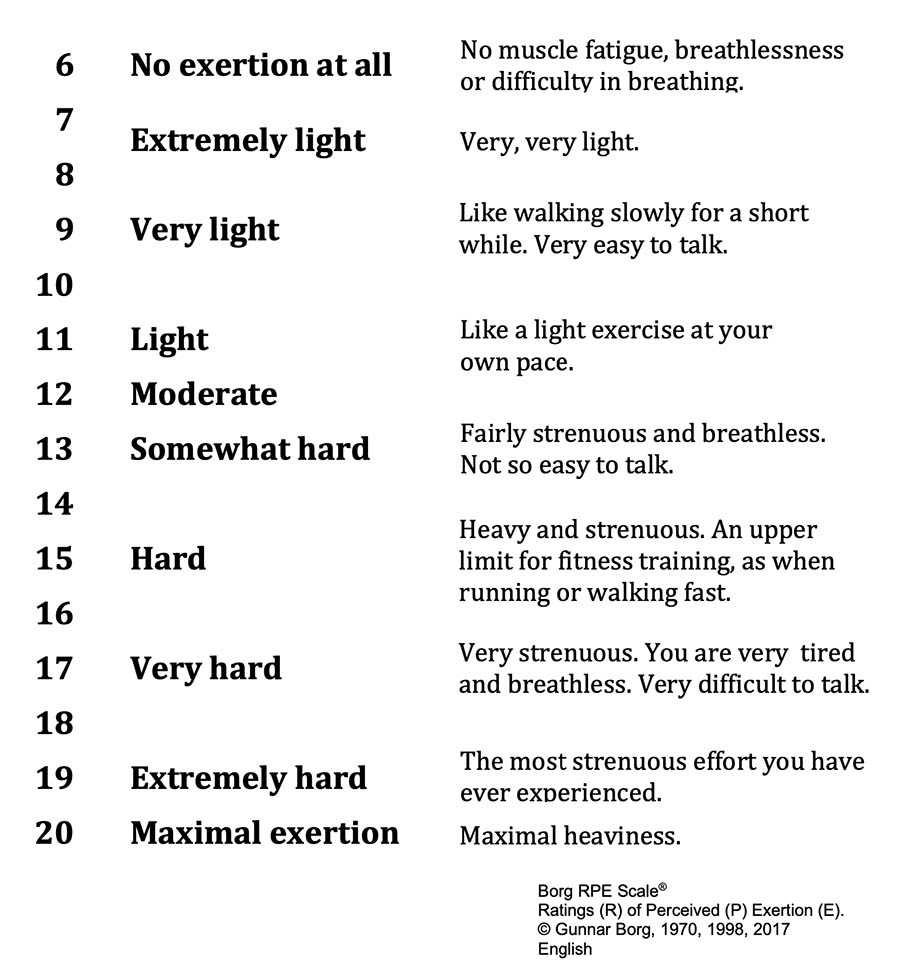
Borg constructed the RPE scale to follow HR for work on the bicycle ergometer in healthy middle-aged men, with HR being about ten times the RPE value. Later, Borg (1974) noticed that the correlation wasn’t as high for other subject groups, such as older people and patients in rehabilitation. That opened the room for the CR10 scale.

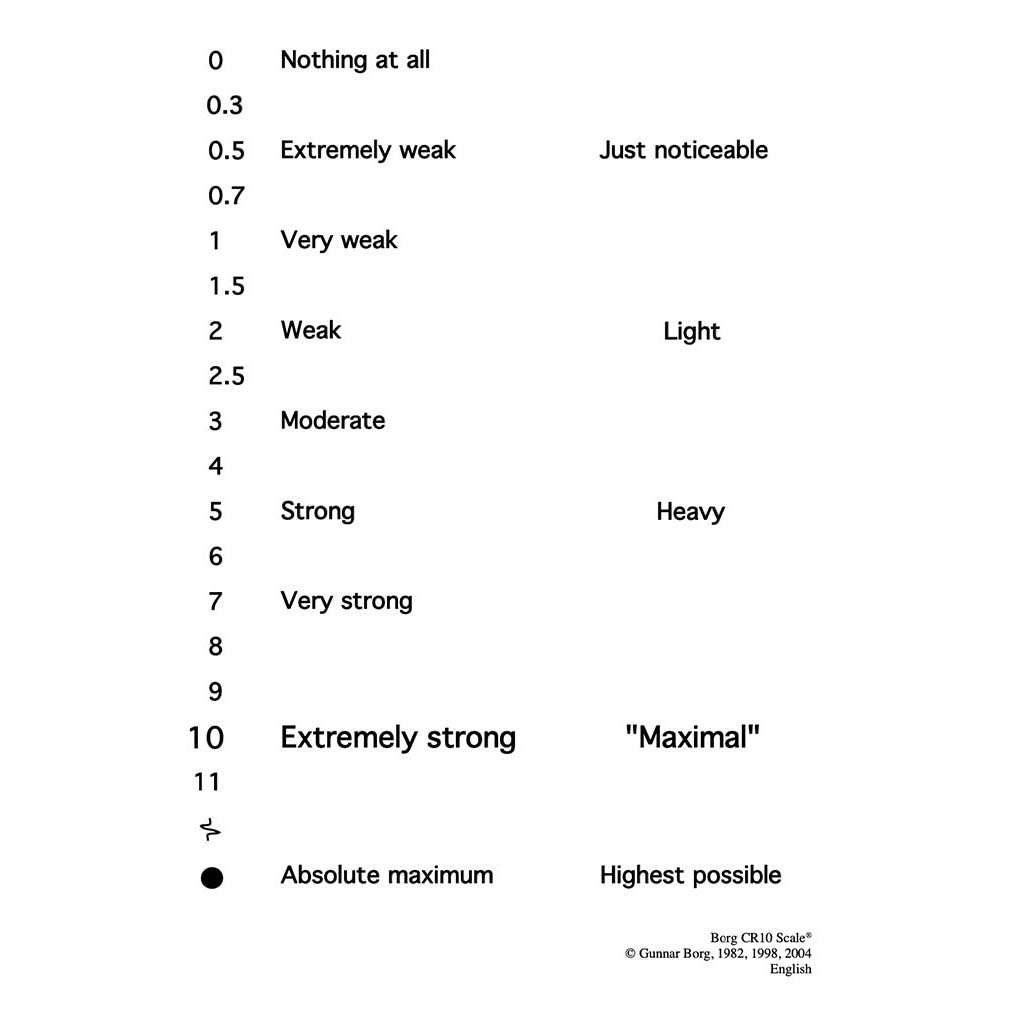
Borg CR10 Scale
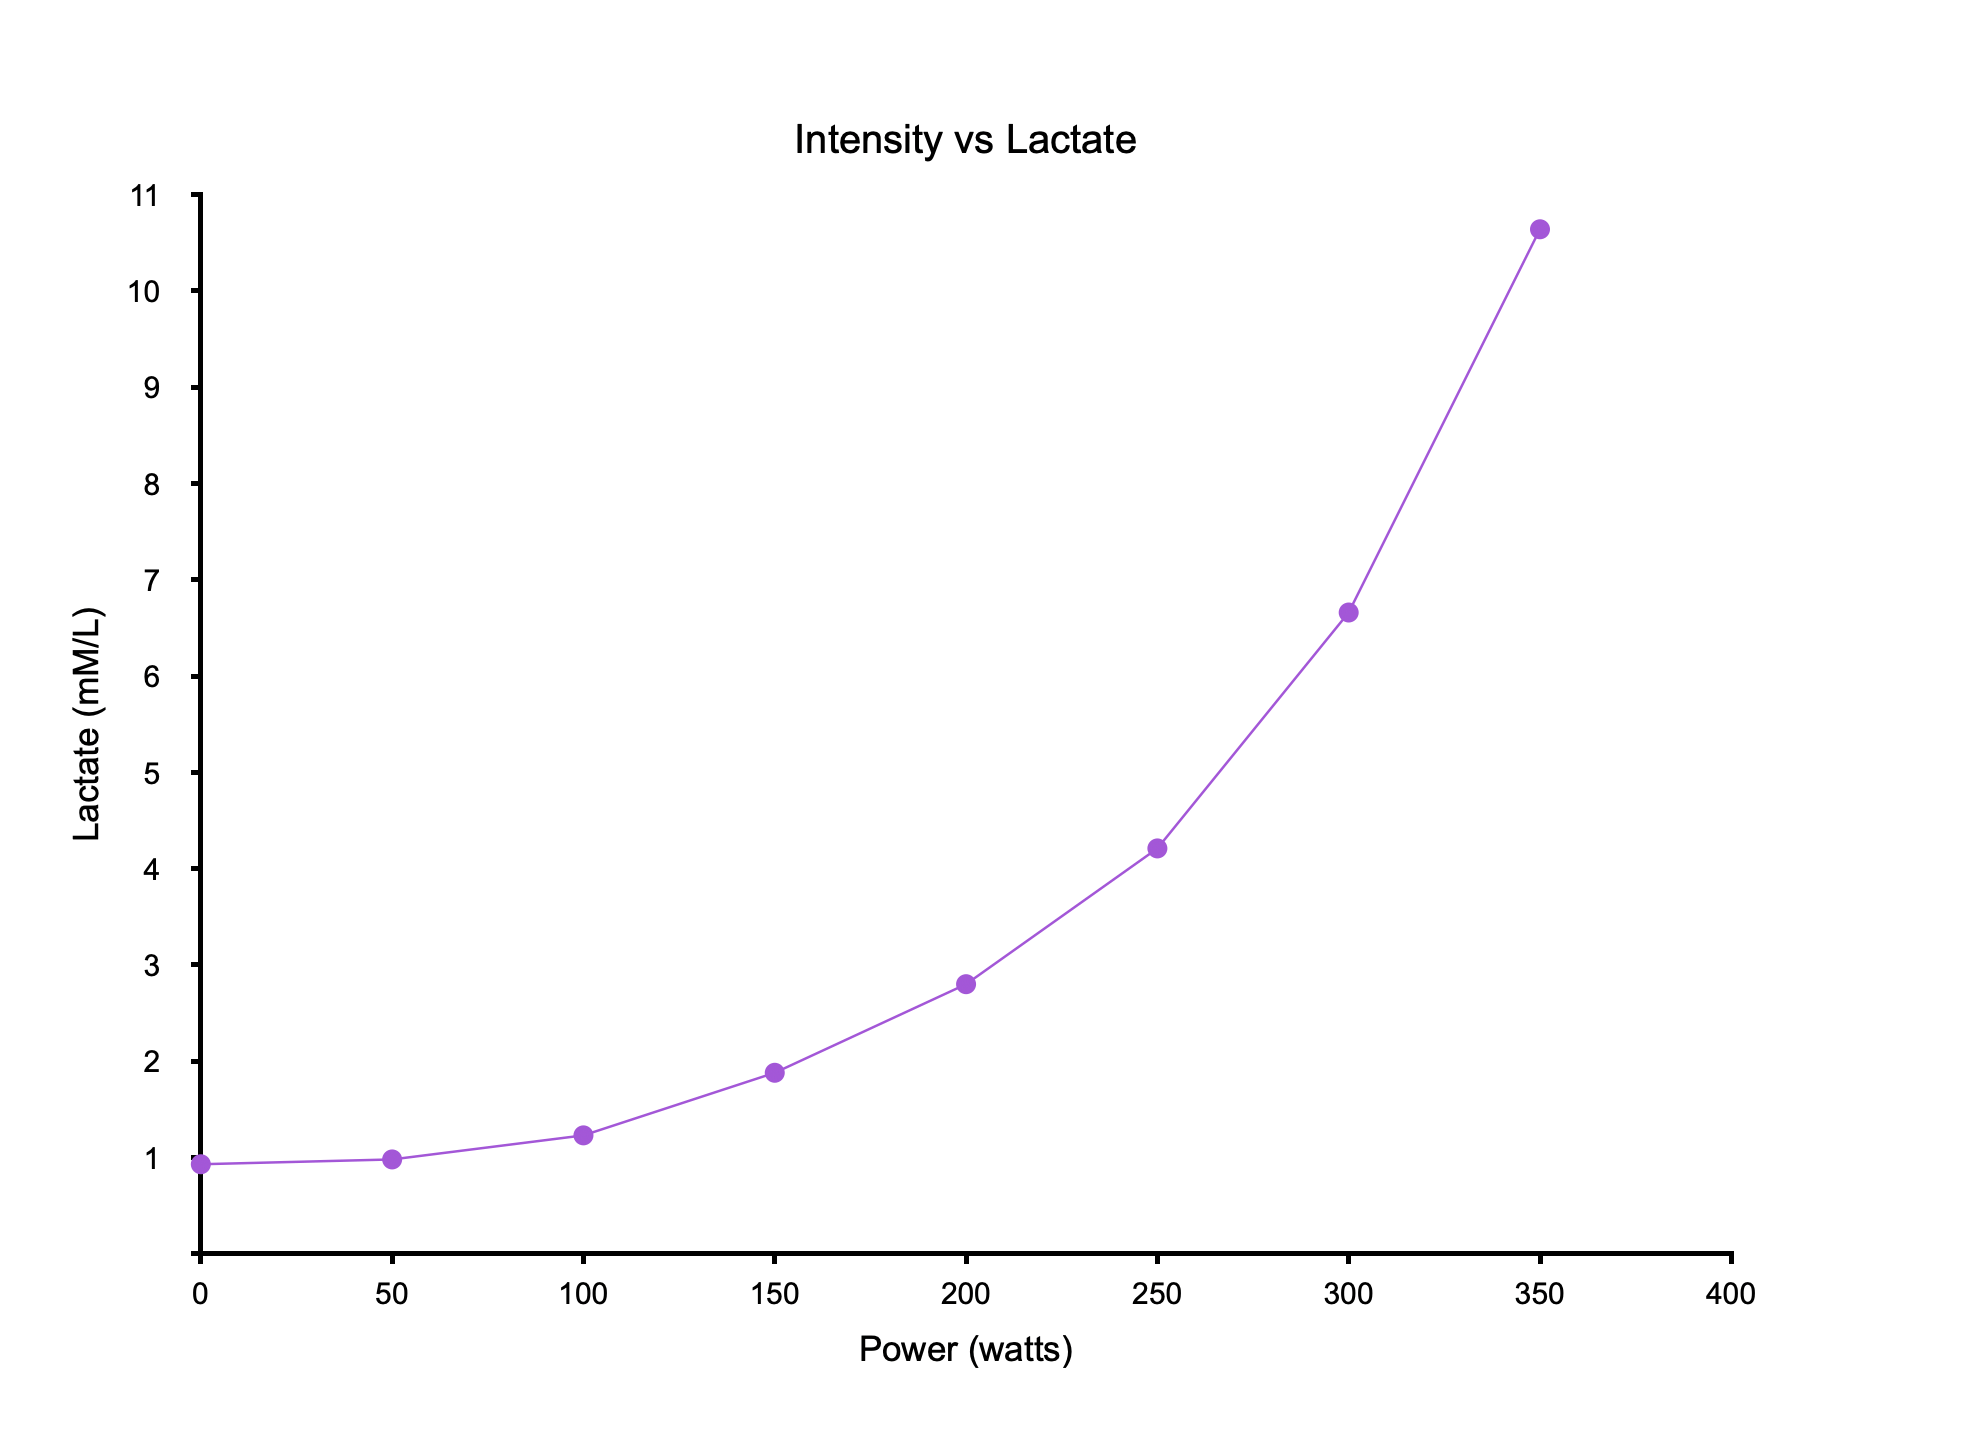
The second RPE scale is the Borg CR10 scale (Image 3), where CR stands for category-ratio, and it considers other variables (e.g., pain perception or blood lactate) that follow positively accelerating power functions (Image 4) with exponents of about 1.6-2, as Borg explains in a 1985 article. In 1998, Borg noted that perceived effort increases with power, but other physiological variables (e.g., sensations from working muscles, joints, skin, and the cardiovascular and respiratory systems) also affect perceived effort. Therefore, a compelling prediction value of perceived effort was available from increased heart rate and blood lactate function.
Using RPE Scales in Training
Both the RPE and CR10 scale can guide your training regimen, aiding in the correlation of perceived effort scores with metrics like power, pace, or heart rate zones (as outlined in Table 1). It’s crucial to recognize that the perceived effort associated with an equivalent level of effort can vary based on many factors, such as your fitness and fatigue levels, environmental conditions (such as cold versus hot, dry versus humid), injury/illness, and your state of recovery.
Lastly, bear in mind that your PE scores might differ from others during workouts or intervals that require similar relative effort levels (e.g., percentage of FTP). This variance boils down to perception, underlining the subjective nature of the experience.
Proposed CR10 scores for endurance training zones:
| Zone | CR10 score |
| Recovery | 1-2 |
| Endurance | 2-3 |
| Tempo / Sweet Spot | 3-4 |
| Threshold | 5-6 |
| VO2 max | 6-7 |
| Anaerobic capacity | 7-8 |
| Neuromuscular power | 9-10 |
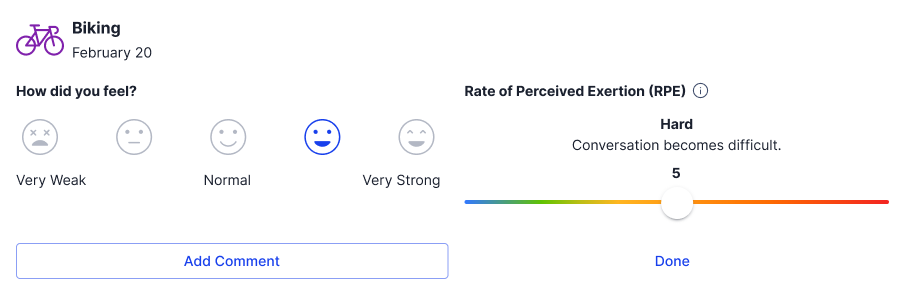
TrainingPeaks Workout Card PE Slider and Examples
TrainingPeaks web and mobile apps offer a PE slider to help you track your workout scores (see image at the beginning of the article). Try to make a habit of setting it immediately after completing your workouts. As you build your PE history, it becomes a robust database to track changes in performance and recovery.
Keep note of workouts where there are differences between what was planned and what was actually accomplished. These workouts hold significant value when it comes to refining your training regimen, programming performance assessments, or discussions between coach and athlete.
A prevalent error in training that often results in performance plateaus is the misjudgment of training zones, either by underestimating or overestimating them. This common misstep can hinder progress significantly.
However, there’s a remedy that can yield positive results: PE scores. When consistently tracked, PE scores serve as an excellent tool for monitoring shifts in performance and overall health status, particularly when comparing different rounds of performance tests.
References
Borg, G. (1998). Borg’s perceived exertion and pain scales. Retrieved from https://psycnet.apa.org/record/1998-07179-000
Borg, G., et al. (1985). The increase of perceived exertion, aches and pain in the legs, heart rate and blood lactate during exercise on a bicycle ergometer. Retrieved from https://pubmed.ncbi.nlm.nih.gov/4065121/
Borg, G. & Dahlstrom, H. (1962, August) The Reliability and Validity of a Physical Work Test. Retrieved from https://pubmed.ncbi.nlm.nih.gov/13871282/
Borg, G. & Noble, B. (1974, January). Perceived exertion. Retrieved from https://pubmed.ncbi.nlm.nih.gov/4466663/


