
One of the hardest things to tackle as a coach is teaching runners the language of training. Runners often come to me understanding vernacular words such as intervals, tempo and strides.
As a younger coach, I would lose my athletes when I started talking about ATL, CTL and TSB. Once runners got the understanding of the acronyms dialed in — they had to learn how to utilize the numbers.
Better Questions Require Better Data
With better questions come better decisions. As an engineer and coach — data tells a story and gives depth to the picture — I have always believed that when we can look a little deeper we can move beyond simply subjective determinants like a good run vs. a bad run. It gives us objective determinants to further analyze with. We can repeat workouts and track our efficiency through pace and heart rate (PA:HR) on a given route four weeks later, we can take snippets and snapshots and understand how we performed in each interval beyond the 400-meter split. If we want better anything we need a clear picture with the ability to look deeper into our workouts.
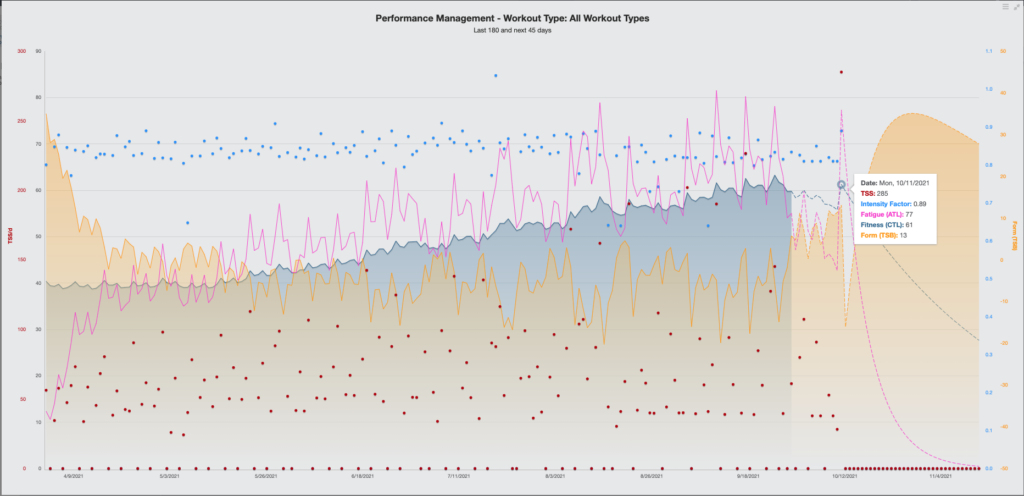
Predicting a Performance — CTL
It’s a growing theory of mine that a proper and appropriate taper for an athlete is when the 24 hour TSS load of the athlete doesn’t push their response or predicted CTL beyond the highest CTL they achieved in training. It’s a working theory, testing approximately 25 athletes to date. Currently, it’s been fairly consistent in predicting marathon times in 20 of the 25 cases used.
This means that if an athlete has a proper build-up and hits a CTL of 63 — they should be able to perform an effort that produces enough TSS load to produce a rise of 63. Athletes can always surprise you — and themselves — and produce a better result on the day, but in my experience, this fairly accurately predicts race day performance.
For those curious, I normally use pace zones of .91 to .95 for marathon training and this is what I set in the workout builder to achieve the “predicted” results. This prediction is also what I use four to seven weeks out to guide our more critical workouts and build confidence.
Understanding Decoupling — PA:HR
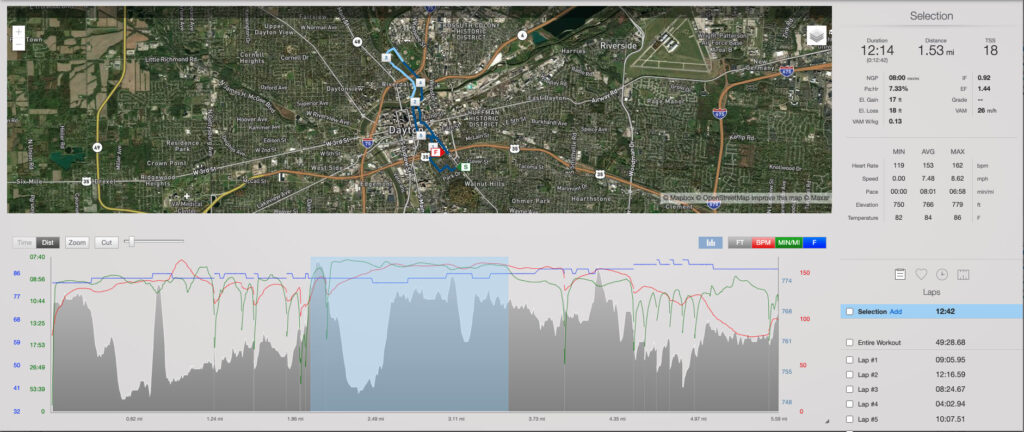
If I had one marker for success with my athletes that demands the most control, defines their capability rep to rep, and determines the success of a workout — I look to decoupling via PA:HR. Within the 0-5% range, we’re in a happy place. To best understand decoupling — imagine two parallel lines of PA:HR. When they are parallel we’ll have a 0% decouple.
To achieve a positive correlation two things must happen: 1) HR must drift upwards while pace maintains or 2) HR maintains and pace declines. An example could be an athlete who runs a 5K test and goes out too hard, then fades in the final 1000-meters while their HR is pegged.
When I analyze the workout above. I’m looking for a few things. Mainly, how quickly did we achieve the “plateau” of the main set or interval. This can tell us if the athlete progressed too quickly to the pace — after the athlete walked a crosswalk they attempted to get up to goal pace taking 4:00 achieve the heart rate plateau with a decoupling of 8.87% (ouch) however, the remaining 8:00 of work they averaged 1.47%. This tells us that despite the downhill there was a significant rise in heart rate perhaps due to form in the downhill, or simply starting off too fast.
A Better Summary of Fitness
The Performance Management Chart is a very visual representation of your fitness, but it only really shows you that you are building the ability to manage more training stress. Until you dig into the trend of the points, it’s hard to know the real story about how these lines and dots truly translate to fitness. There are many ways to build TSS. An athlete could run further at a slower pace and be building a base with zero speed work. Is that better fitness? It depends on your definition.
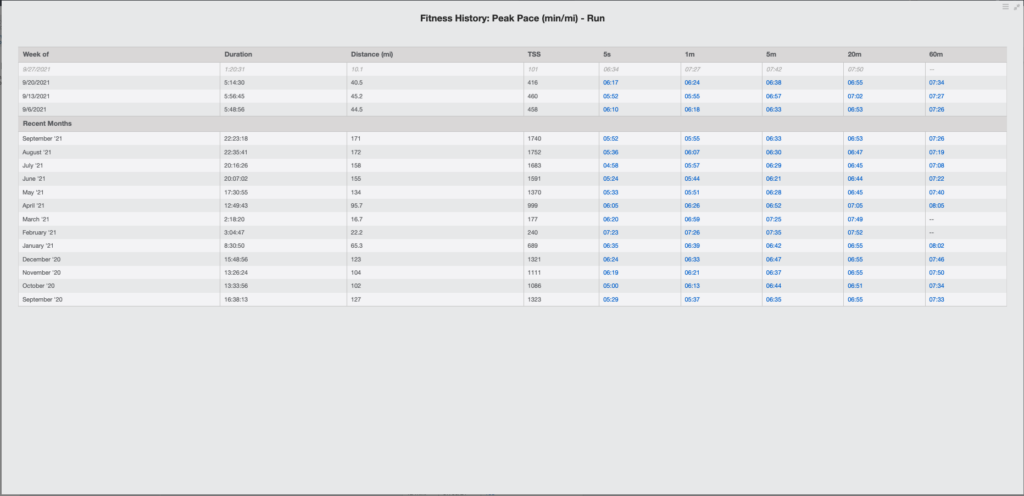
If fitness is defined as a combination of speed and load, the best measurement could be the fitness history chart. There, you can look at Peak Pace, Pace by Distance, and Heart Rate.
To evaluate if they are building more than just the ability to manage training stress, you can use this chart to understand if adaptations are being built over time. Sixty-minute speed month-to-month is a motivating metric for many marathoners, and 20-minute speed is motivating for many athletes focused on the 10K. If you see a metric go the other way, take a deeper dive into why that may be. Better questions equal better decisions.
Did you do many runs or hard intervals over 20 or 60 minutes? Were conditions suitable for fast running in those time frames? These two questions alone can determine why fitness may not have added up when it needed to.
This is a phenomenal tool to use to analyze post-race and post-season to set dynamic goals for the next season. You can start to set compound goals whereby you achieve a certain CTL while targeting a 60-minute average pace or increase weekly run distance in conjunction with fewer weekly hours. Or even create more regular streaks above a certain mileage mark while continuing to build your CTL.
Actionable Running Training Data
When you take the time to move from a subjective view of training, you begin to understand the value of a coach that knows the software and the tools to elicit the best results. The duo of athlete and coach allows us not only to ask better questions and make better decisions, it also allows us to marry the subjective and objective running data in a way that leads to success race after race!


