
If you watch any bicycle race broadcast here in the UK, you’ll likely hear Dan Bigham say, “Something, something saving 7-10 watts.” His work clearly paid off, as he’s now working as an aerodynamic engineer at INEOS. It’s everywhere on new products too, with claims of “this saves some given number of watts” brandished over many products and web pages. The rarely answered questions are what is a watt and what does it mean to save watts? And furthermore, how does the interface of power and aerodynamics affect a cyclist?
What is a Watt?
To understand this conversation in full, it’s worth knowing the origins of the watt. A watt is a unit of power, and power is defined as the amount of energy you are expending per unit of time. The amount of power out of a system divided by the amount of power put in is how we calculate the efficiency of said system. In our case, the “system” is usually a cyclist and a bike. As we know, endurance sport is all about efficiency. Measuring power on a bicycle allows us to see how much energy a rider can transfer to the pedals during a set period. Simply put, the more energy transferred means a bike will move faster … sometimes.
The problem is, not all that power goes into forward motion. Much of it, though, goes into fighting everything trying to slow us down. Isaac Newton once said that “every action has an equal and opposite reaction,” and if we push harder on the pedals, the wind pushes back just as hard. There is a blog talking through all of the things slowing you down while cycling. Whenever you do anything, physics is generally working against you.
The Drag Equation and Making a Toy Model
We know roughly what power means now, but what does saving it translate to? We often hear about how much power has been saved but much less about what these savings really mean to us. To figure out our savings, we will need a little bit of mathematics. Luckily, lots of work has been done in the field of fluid dynamics that makes this concept relatively manageable—air is a fluid in this context. I won’t derive the fluid equation here, so you’ll have to take it on faith that it’s correct. However, if you don’t trust me, it’s worth watching this.
This equation is our foundation:
𝐅𝑑 = ¹∕₂𝘱𝓾²𝙘𝑑A
Depending on your mathematical background, this will look very simple or very complicated. I will explain this equation as simple as possible without losing important detail, as it’s the basis for the data visualizations you will see in this post.
𝐅𝑑 — This symbol, or “term,” represents the drag force. It’s a measure of how hard the air pushes back on us.
𝘱 — This term represents the air density (in our case of riding a bicycle). It measures how many particles there are in a fixed volume of air. This is an example of environmental conditions making a considerable difference in our bike speed. It’s why many hour record attempts happen at altitude, despite the power loss seen there.
𝓾² — This term represents the flow velocity relative to the object. Consider this to be your “wind speed.” The little two means that it’s 𝓾 X 𝓾. This is important because aerodynamic drag force has a more significant impact proportionally at higher speeds.
𝙘𝑑A — This term is one we hear talked about a lot. It represents your “coefficient of drag” multiplied by your frontal area. Reducing either your “coefficient of drag” or your exposed surface area will speed you up.
You’ll notice here that force is what is described in the equation, but we aren’t interested in force as our power meter measures power. Luckily, force and power are related, and we can use this relation to make a model.
Force and power are closely related, and we shall use this relationship to create a new equation. The key lies in that if an object is moving at constant velocity under the impression of a constant force, we can write this: 𝑷 = 𝐹𝑢
Where 𝑷 is power and 𝐹 is force. The term 𝑢 is the same as it was earlier, speed. We can use this relationship to write our aerodynamic equation regarding power. Note that this is a little bit of a bodge and only works for constant speed and constant power. Having a model that works for changing power values, speed, weather conditions and more are best left to the wonderful people over at Best Bike Split, and this is for illustration purposes only. We need to add in rolling resistance and gravity. We can deal with gravity by assuming we are on a pan-flat road, and rolling resistance we can estimate — let’s call it 20W for now. There are subtleties in rolling resistance that we have blazed over here, but let’s ignore them for now to simplify an already complex calculation. We will also drop in some drive train losses of 10W. This is where the “plus 30” term comes from in our toy model.
𝑷 = ¹∕₂𝘱𝓾³(𝙘𝑑A)+30
Using Our Toy Model
OK, so we have our equation. We shall turn this equation into a model by writing a little bit of code. Let’s remember, our model is only as good as the assumptions we make. Let’s drop some numbers in. Air density at sea level, a 𝙘𝑑A of 0.3 and a speed of 35kph, which is reasonable for an age grouper in a middle-distance triathlon. What power do we need? This model gives us an average power of 200W.
We can use this model to see how hard a rider has to go to ride at a certain speed. Imagine a rider in a standard jersey and shorts on a road bike with a typical road helmet. This means our rider has a 𝙘𝑑A of 0.4 (an estimation for illustrative purposes). The line represents how many watts a rider needs to push for a given speed.
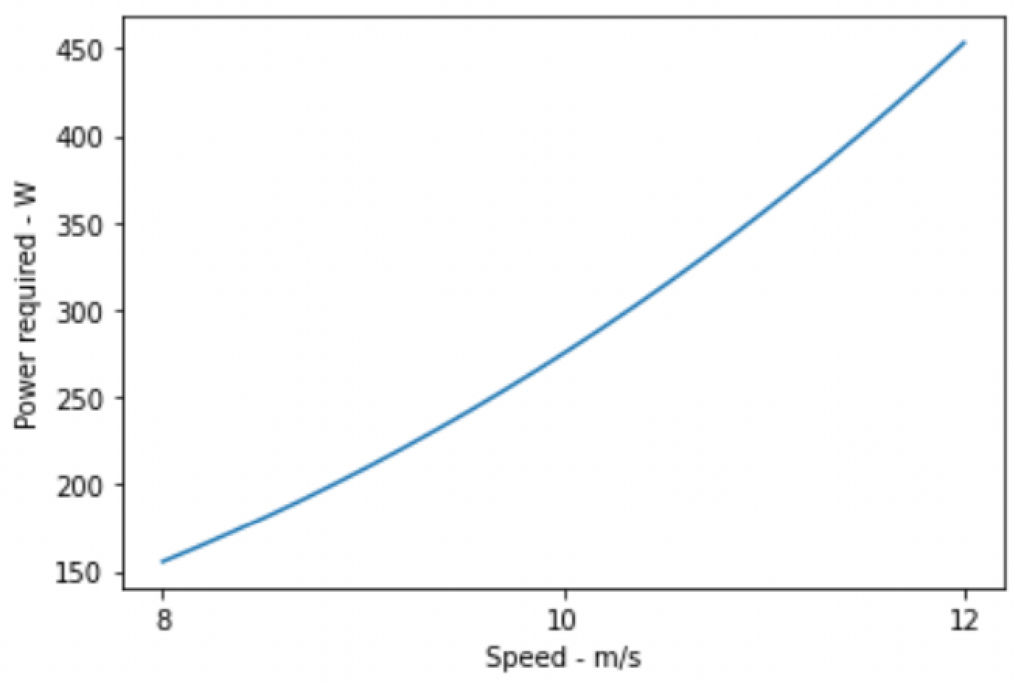
The line represents the power a rider would need to travel at any given speed. This graph ranges from around 18mph to 26mph, a typical spread of speeds seen across a 70.3 bike course of a triathlon. As you can see, as the coefficient of drag decreases, the line shifts lower.
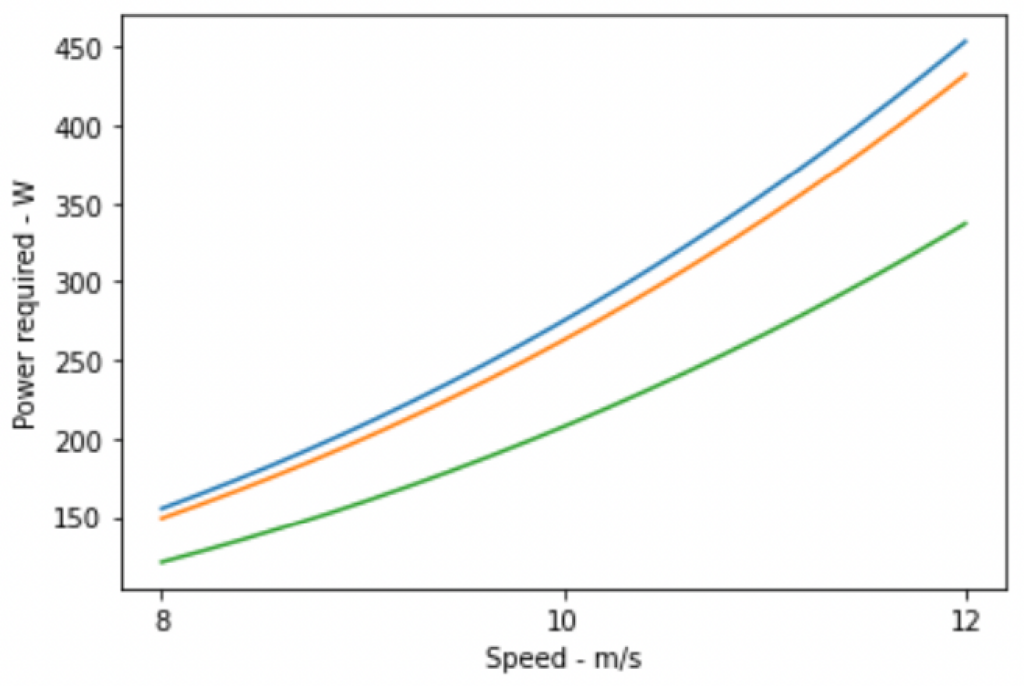
Now, let’s make our rider a touch more aerodynamic. Imagine they buy a skin suit after reading this blog, and this leads to a 5% reduction in 𝙘𝑑A, which means it goes from 0.4 to 0.38 – what happens? There is a reduction in power needed to maintain a similar speed, as evidenced by the orange trend line. And, to take it a step further, our rider gets on a time trial bike, which reduces their drag coefficient by 25%. This moves their 𝙘𝑑A from 0.38 to 0.29, and we see an even greater improvement by the green trend line.
Less Power Isn’t Always Bad
We know that changes in body position on-bike can lead to changes in drag and power output needed to maintain a set speed. This leads to an actionable coaching conclusion — less power is not always worse, provided it’s offset with improved aerodynamics. There may also be an advantage to using less power on the bike for the same speed: more energy left for the run.
For example, if a positional change causes a rider’s maximal power to decrease, but the speed is the same, this may be advantageous anyway, as an energy usage reduction still occurs. This, combined with an optimal fueling capacity, will lead the athlete to the run with more left in their glycogen stores. However, comfort and muscle utilization should also be considered. If a more aerodynamic position fatigues muscles relied upon for running, it might offset any gains made from energy saving. A holistic approach is necessary here, and having a bike fitter familiar with the triathlon demands is essential. If your athlete is only a cyclist, the conclusion is somewhat more straightforward. Find the proper position for whatever is fastest.
What Does It All Mean?
This example of aerodynamic benefits is an example from a model. The main takeaway is that the typical opinion of more power being the ideal and less being bad doesn’t necessarily ring true when factoring in aerodynamics. The reality is that endurance sports are races, and you win races with speed. Not necessarily with impressive power numbers in your TrainingPeaks account. Performance at an event is certainly in the preparation, and athletes should prepare to go as fast as possible. A large FTP helps, but it’s clearly not the end all be all. Getting as aerodynamic as comfortable should be the primary aim of a cyclist wanting to perform well in a race or a triathlete where drafting is not allowed.

")

")


