
Analyze 360 in TrainingPeaks is designed to interpret physiological signals that traditional charts aren’t built to handle. Such metrics add context for why power, pace, and heart rate drift even when a workout looks the same on paper.
Sensors like CORE, Tymewear, and hDrop provide valuable information on internal workload, thermoregulation, and hydration, and coaches and athletes need a way to see how these metrics influence power, pace, heart rate, terrain, and workout structure.
Analyze 360 allows you to layer these metrics, create custom laps from any portion of a session, and evaluate how physiology, environment, and intensity combine to influence performance.
How to Analyze Core Body Temperature
Analyze 360 lets you see three important metrics from your CORE sensor: core temperature, skin temperature, and Heat Strain Index. These help you understand how thermoregulation affects your performance.
What is core temperature and heat stress?
Core temperature is largely influenced by exertion level: Only ~20% of the calories you burn go toward muscular power – the rest of the energy is converted to heat. For example, when you pedal at 200 watts, you’re also creating 800 watts of heat inside your body. When you generate more heat than your body can dissipate to your surroundings, your core temperature rises.
A cool skin temperature is critical to dispersing heat. When it’s too high, each unit of blood in the skin loses very little heat. So the body must send more blood to the skin to cool it down. This diverts blood away from the muscles and causes heart rate to increase. This is heat stress, and it causes performance loss.
What is the Heat Strain Index and Heat Zones?
CORE’s Heat Strain Index makes it easy to see how you’re experiencing heat stress. It combines core temperature and skin temperature into a simple metric with values ranging from 0 to 10, divided into four Heat Zones.
Heat Zone 1, HSI 0 to 0.9: No heat strain. Even if core temp is elevated, skin temp is cool enough for optimal performance.
Heat Zone 2, HSI 1.0 to 2.9: Moderate heat strain. Both core and skin temps are elevated. Heart rate is starting to decouple from power/pace. You feel warm and performance may be lower than usual.
Heat Zone 3, HSI 3.0 to 6.9: High heat strain. Both core and skin temps are high. You’re sweating heavily, you feel hot, and heart rate has substantially decoupled from power/pace. Performance and exercise capacity are substantially reduced. This is also the zone where heat training is performed.
Heat Zone 4, HSI 7.0 and higher: Extremely high heat strain. Exercising in this zone for too long may have severe consequences for your health and may place you at risk for heat-related illness. Performance is drastically reduced.
How to Analyze a Workout for Heat Strain
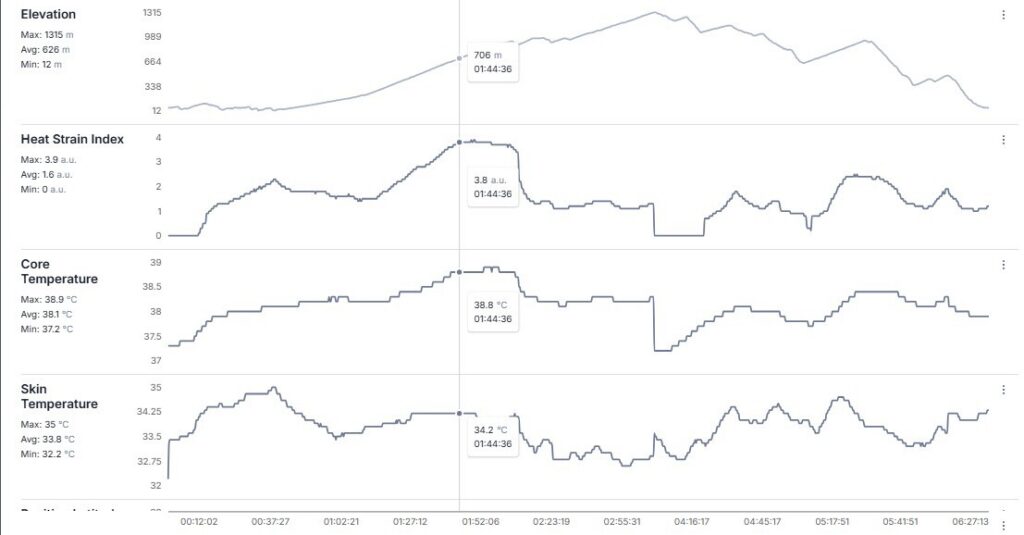
Analyze 360 lets you easily see where your performance suffered due to elevated heat strain.
In this example of a 6:30-hour ride, the Heat Strain Index rose to 3.8 after an hour of steady-state climbing. Power-to-heart-rate decoupling was about 8% during this climb, indicating the performance effects of an HSI >3.0. This athlete is very well heat-adapted; her decoupling would have been higher at a HSI of 4.4.
After that, the athlete took cooling measures to reduce skin temp and subsequently reduce core temp. During a later climb, core temp started to climb again, but a high Heat Strain Index was avoided by keeping skin temperature low (by dousing with water bottles).
The other instance of high skin temperature was 30 minutes into the ride. Because core temperature was still moderate, there was not heavy sweating. But when core temp reached a threshold, the sweat response really kicked in and skin temperature dropped quickly, keeping core temperature in check. This is a typical sweat response at the start of a workout.
How to find heat thresholds: Heart rate decoupling caused by heat strain
You can use Analyze 360 coupled with Analyze mode to identify heat thresholds. It will help you identify the Heat Strain Index where performance declines. Do this during an indoor ride/run.
1. Start with fans and normal indoor clothing. Ride/run at zone 2 power/pace for 15 minutes. Your heart rate should have stabilized by the end of the 15 minutes.
2. Turn off fans and add warm clothes – a waterproof layer to trap sweat, and a thermal layer above the waterproof layer.
3. Maintain the heart rate you had at the end of the 15-minute warm up. Reduce power/pace as needed as Heat Strain Index rises.
4. When power/pace has decreased by 15–20%, end the workout.
5. Using Analyze 360, look at the Heat Strain Index associated with various amounts of heart rate decoupling. For longer events, most consider 5% the maximum amount of decoupling for optimal performance.
6. Once you’ve identified that HSI threshold, do extended testing where you maintain that HSI and observe how heart rate decouples from power/pace at longer efforts.
Troubleshooting a Heat Session
Heat sessions are performed between Heat Strain Index 3.0 and 6.9. Athletes new to heat training sometimes struggle to reach HSI 3.0. Analyze 360 can help you troubleshoot. Look at both core temp and skin temp. A heat session generally sees a core temp higher than 38.0°C/100.4°F and a skin temp higher than 35°C/95°F.
- If core temp is lower than 38.0°C/100.4°F, try higher power/faster pace.
- If skin temp is lower than 35°C/95°F, warmer clothes are needed.
The typical clothing error is to put thermal layers beneath waterproof layers. This causes the thermal layer to get sweat soaked and cool you.
Additional information about how to do a heat session and advanced metrics like Heat Training Load and Heat Adaptation Score are found in CORE’s Educational Resources.
How to Analyze Breathing Rate
Breathing, which can be measured by Tymewear VitalPro, is a window into two key training variables: internal workload and perceived exertion.
Breathing is defined by the volume of air that goes in and out of the lungs and is measured by two independent signals: Breathing Rate (BR) (the number of breaths per minute), and Tidal Volume (VT), the volume of air per breath. Taken together, they produce Minute Ventilation (VE), the volume of air flowing through the lungs. As a stand-alone metric, VE is sufficient for identifying ventilatory thresholds.
Formula: VE = BR x VT
Internal Workload
The air flowing through our lungs reflects our muscles’ workload. We breathe in oxygen that our muscles consume, and we breathe out CO2 that our muscles produce.
During exercise, CO2 is a primary driver of breathing. The higher the internal workload, the more CO2 is produced with a corresponding breathing response.
During Zone 2 work, we produce very little CO2, and breathing is stable. By contrast, when we do VO2max work, CO2 production rises with a corresponding increase in breathing. This effect makes breathing excellent for individualizing training zones via ventilatory thresholds, and an ideal target for intensity control, particularly Zone 2 workouts. (Maunders et al 2025)
Perceived Exertion
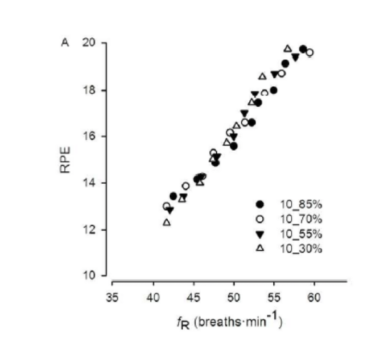
Breathing rate (BR) is a reliable proxy for perceived exertion, studies show.
As perceived exertion increases, breathing rate increases. Breathing Rate Reserve (BRR) is a useful way to calibrate each individual’s breathing rate response. The live BR is a percentage of the Reserve and serves as a gauge of perceived effort, ranging from 0 to 100%.
Formula: BRreserve% = (Live BR – BRresting)/(BRmax – BRresting)
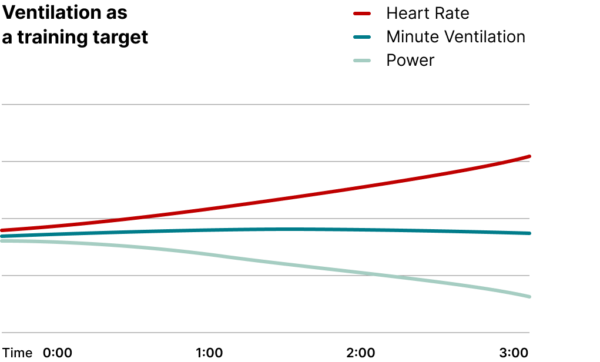
What happens when internal workload stays constant and perceived effort increases?
For example, a long run or ride at a low intensity can be at a constant workload, but it will feel easy at the beginning and harder at the end due to fatigue.
So how does breathing respond?
The Breathing Rate and Tidal Volume decouple to express perceived effort and internal workload. As perceived effort rises, Breathing Rate will begin to increase. But because the internal workload is constant, the Tidal Volume will decrease to keep the overall Ventilation constant. (Maunders et al 2024)
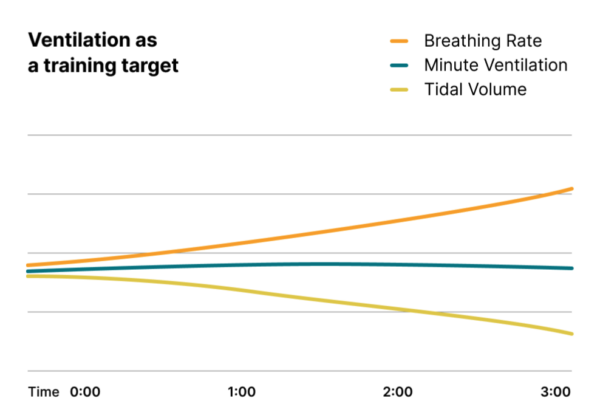
Measuring breathing gives us a new window into training, helping us better understand how hard the body is working and how effort is perceived.
Minute Ventilation reflects the true internal workload, while Breathing Rate correlates with the perceived exertion. When fatigue accumulates, these two signals decouple, revealing stress that heart rate, power, and pace alone often miss.
By understanding how Breathing Rate and Minute Ventilation interact across intensities and over time, you gain more precise, individualized control over training intensity and stress, and over achieving the intended adaptation.
How to Analyze Sweat Rate
In TrainingPeaks, pairing your hDrop sweat-loss and sodium-loss data with power and HR lets you see when losses accelerate.
Unlike single-use patch systems, hDrop provides continuous, real-time sweat rate and sodium loss data throughout a session, improving ecological validity compared with static post-session testing. (You can learn more about the technology behind the sensor here: https://hdroptech.com.)
Independent scientific validation has shown that hDrop can accurately quantify both sweat rate and sodium loss during dynamic exercise conditions, supporting its use for performance hydration planning rather than relying solely on pre- and post-session body mass change.
What is sweat rate, and why does it matter?
Sweat rate is a real-time “cost of doing work:” as power and heart rate rise, metabolic heat production rises, core temperature trends up, and the body increases sweating to maintain heat balance.
In TrainingPeaks, pairing your hDrop data with power and HR lets you see when losses accelerate. This matters because sweat sodium concentration tends to rise as sweat rate rises, largely because faster sweat flow leaves less time for sodium to be reabsorbed in the sweat duct, increasing sodium concentration and total sodium loss.
This means two sessions with the same average power can have very different sodium losses if the “3-minute slope” of sweat rate is higher due to heat, humidity, or a harder surging profile.
That is the actionable layer: you can identify intensities (or HR zones) where sodium loss ramps up and then plan fluids and sodium to match the rate of loss, not just session duration.
How often should you measure sweat rate?
A single sweat test is rarely enough because sweat rate and sweat sodium can shift meaningfully with context.
Continuous monitoring across sessions with a wearable sweat sensor like hDrop allows athletes to capture variability in heat, humidity, and intensity without repeating laboratory sweat tests. This allows you to better plan hydration without constantly testing.
Day-to-day variability exists even within the same athlete, and the drivers are predictable: exercise intensity, ambient temperature, solar load, humidity (which impairs evaporation and can push sweat rate higher), wind (which increases convective and evaporative cooling and can reduce sweat needs), clothing or protective equipment, hydration status, heat acclimation, aerobic fitness, and more.
Recent controlled work in trained athletes also shows why “one condition” does not generalize: exercise sweat sodium increased from low to higher intensities alongside sweat rate, and a resting pilocarpine test showed intensity-dependent bias (it overestimated low-intensity exercise [Na+], aligned best at moderate intensity, and underestimated at high intensity).
Interpreting Sweat Rate in Training
The takeaway for athletes is straightforward: capture sweat rate and sodium losses across representative conditions (easy vs. hard days, indoor vs. outdoor, cool vs. hot, dry vs. humid) and review them in TrainingPeaks alongside weather context and core training metrics like power and heart rate. That combination helps you see how intensity and environment shift your losses, so you can plan hydration and sodium strategies for the sessions and races you actually do, not a single one-off snapshot.
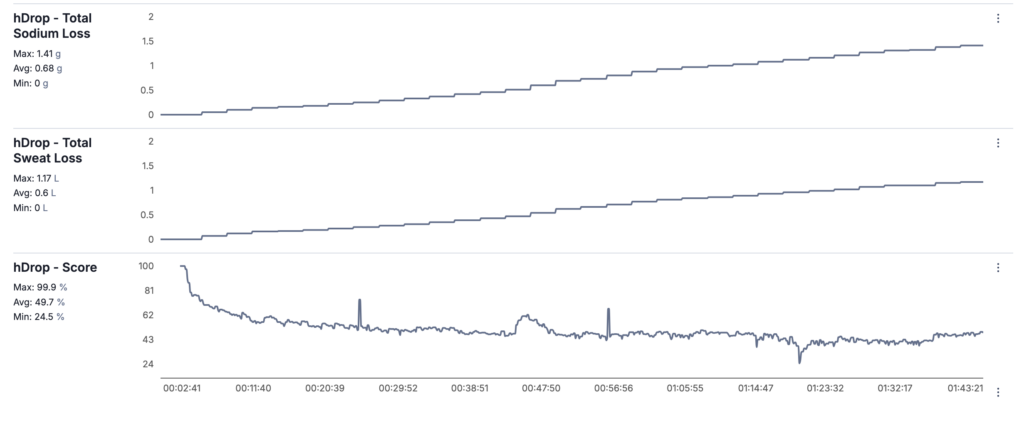
In TrainingPeaks, you can analyze sweat rate by lining up hDrop metrics (sweat rate, cumulative sweat loss, sweat sodium concentration, and total sodium loss) with session intensity (power and heart rate) plus the built-in weather context (temperature, humidity, wind, and whether the session was indoor or outdoor).
Because hDrop measures sweat rate in real-time rather than estimating it retrospectively, athletes can detect intensity-dependent accelerations in sweat sodium loss that would be missed by traditional single-point testing methods. That matters physiologically because sweat rate rises as metabolic heat production increases with higher exercise intensity, and it is also strongly shaped by environmental factors (heat, sun, humidity, wind) and acclimation status.
Next, look at how losses change over time, not just the totals: compare 3-minute “slopes” in sweat rate and sodium loss against changes in power and HR (surges, climbs, steady-state blocks). Sodium concentration in sweat often increases as sweat rate rises because faster sweat flow reduces the time available for sodium reabsorption in the sweat duct.
Finally, turn the analysis into a plan by matching intake to loss rate while avoiding overdrinking: use sweat rate to set a practical fluid target per hour and total sodium loss to estimate sodium per hour needs, then validate across multiple representative sessions because both sweat rate and sweat sodium show meaningful within-athlete day-to-day and condition-to-condition variability, and even “single-test” methods can be intensity-dependent.
For athletes seeking data-driven hydration planning, wearable sweat sensors such as hDrop provide continuous, reusable, and field-valid sweat rate and sodium loss measurement. Compared to one-time patch testing or body mass change estimates, real-time monitoring improves precision, captures environmental variability, and allows hydration strategies to be aligned with actual physiological demand.
Your athletes’ outputs only tell part of the story. By integrating advanced physiology with the rest of the training file, Analyze 360 in TrainingPeaks lets you interpret cause and effect, identify limiters, and prescribe with a level of precision that wasn’t previously possible.
References
Baker, L. B. (2017). Sweating rate and sweat sodium concentration in athletes: A review of methodology and intra/interindividual variability. Retrieved from https://pmc.ncbi.nlm.nih.gov/articles/PMC5371639/
Buono, M. J., Claros, R., Deboer, T., & Wong, J. (2008). Na+ secretion rate increases proportionally more than the Na+ reabsorption rate with increases in sweat rate. Retrieved from https://journals.physiology.org/doi/full/10.1152/japplphysiol.90503.2008
Harris, C. T., Hunt, L., Shepherd, S. O., Hew-Butler, T. D., & Blow, A. V. (2026). Comparison of pilocarpine- versus exercise-induced sweat sodium concentration across exercise intensities in trained athletes. Retrieved from https://physoc.onlinelibrary.wiley.com/doi/epdf/10.14814/phy2.70724
Nicolò, A., Marcora, S. M., & Sacchetti, M. (2016). Respiratory frequency is strongly associated with perceived exertion during time trials of different duration. Retrieved from https://pubmed.ncbi.nlm.nih.gov/26503587/
Périard, J. D., Eijsvogels, T. M. H., & Daanen, H. A. M. (2021). Exercise under heat stress: thermoregulation, hydration, performance implications, and mitigation strategies. Retrieved from https://journals.physiology.org/doi/full/10.1152/physrev.00038.2020
Stevenson, J. D., Kilding, A. E., Plews, D. J., & Maunder, E. (2024). Prolonged exercise shifts ventilatory parameters at the moderate-to-heavy intensity transition. Retrieved from https://pubmed.ncbi.nlm.nih.gov/37495864/


")
