
This article will take a deep-ish dive into how Normalized Power® (NP®) is calculated. To normalize a number in mathematics usually means to scale it between zero and one by dividing this number by its maximum possible value. That math is not the case with NP — it’s more of a weighted average that gives a moderately higher value on larger power numbers by reducing the impact of low power numbers. As you may know, zeros in a math equation can dramatically affect the average.
The aim of NP is to reflect the fact that these variable efforts are physiologically more costly. A ride with high variation (with high powered efforts and low intermittent periods such as intervals) is often more difficult than a ride consisting of moderate steady-state riding. It’s something that, as experienced cyclists, we know from experience; two rides with the same average power can be vastly different in terms of their difficulty. That is why we often want to refer to NP.
The Calculation
Normalized Power is a value calculated by Training Peaks, your head unit, or other software. Generally speaking, the calculation done is the same across cycling measurement tools. The value is derived from Dr. Andy Coggan’s book “Training and Racing with a Power Meter.” This calculation will appear extremely simple or very complicated, depending on your mathematical background. Here I intend to explain it as simply as possible without losing important details. To understand this calculation properly, you need to know how to take an average, what an exponent (or power) is and how to take a root.
- Step 1: Calculate the rolling average power with a window size of 30 seconds. Start at 30s and calculate the average of the previous 30s and repeat this for every second.
- Step 2: Take each value from step one and take this value to the fourth power (multiply this number by itself four times).
- Step 3: Calculate the average of values from the previous step.
- Step 4: Take the fourth root of the average from the previous step — this value gives us the normalized power.

Considerations with This Calculation
As with many metrics available to coaches and athletes to analyze training, there’s a level of approximation that cannot be avoided. For example, the specific values chosen above in step 1 (the length of the window) and step 2 (the size of the exponent) are selected because they reflect that functionally, physiological responses are not instantaneous and don’t have a linear relationship with intensity. But the specific response time and shape of the various curves used to select these values can vary across the population. What happens if we change these values?
Changing them does not necessarily invalidate the calculation, especially when considering individual differences. The easiest way to think about this is to come up with a simple example.
An Example NP Scenario
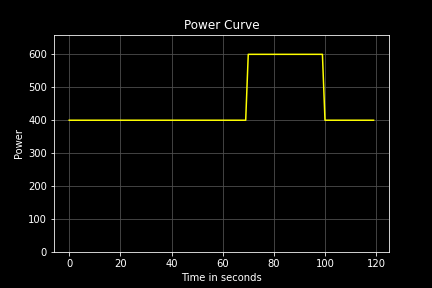
Consider a scenario in which a cyclist rides at 400W for 70 seconds, does a 30s surge at 600W, and then settles back to 400W for 20s. An example could be an attack on a climb or an attempt to make a break. It helps keep the numbers simple. The key to setting up an example is that there must be some variation within the power file, as this is what NP aims to pick up on.
An example file has an average power of 450W and a normalized power of 478W, as calculated by TrainingPeaks. Using computational code gives us the same values as TrainingPeaks. The result provides us with the confidence to go ahead and analyze the NP calculation in a bit more detail.
What Happens if We Change the Calculation?
Changing the time window: Changing the time window used to calculate normalized power over the entire interval window is an interesting exercise as lactate accumulates at different rates across the population. We should see the value trend toward the average power as we approach the length of the interval. This outcome is because, as step 2 and step 4 “undo” each other (a mathematician would say they’re inverse functions), it simply becomes essentially an average power calculation without a difference in the time window to the ride length.
We can see that this value is relatively stable. That is to say, it changes slowly with time, and there are no erratic changes with this curve. You can see it gradually decreasing toward the average power value, and this can be seen more clearly if we change the y axis as a means of zooming in on the curve. Take care to note the change in the range of values shown on the y axis.

At TrainingPeaks, coaches are taught to dismiss NP values for durations under 10 minutes. Before this duration, the 30-second sample is too high a proportion of the period under analysis. The 30-second window should be less than or equal to 5% of the overall interval. NP should not be used to analyze the success of particular intervals during a session on this basis, nor should it judge the difficulty of short periods within races.
We’ve seen the normalized power change for our interval, but the question is still open, why is 30s selected for the “time window”? It is a population level average, as with many metrics, and should be understood. Very fit athletes or very unfit athletes are less likely to fit the population used in the study that set the values in the first place. These exceptions should be considered, especially in the context of an inexperienced athlete, when thinking about managing the overall training load.
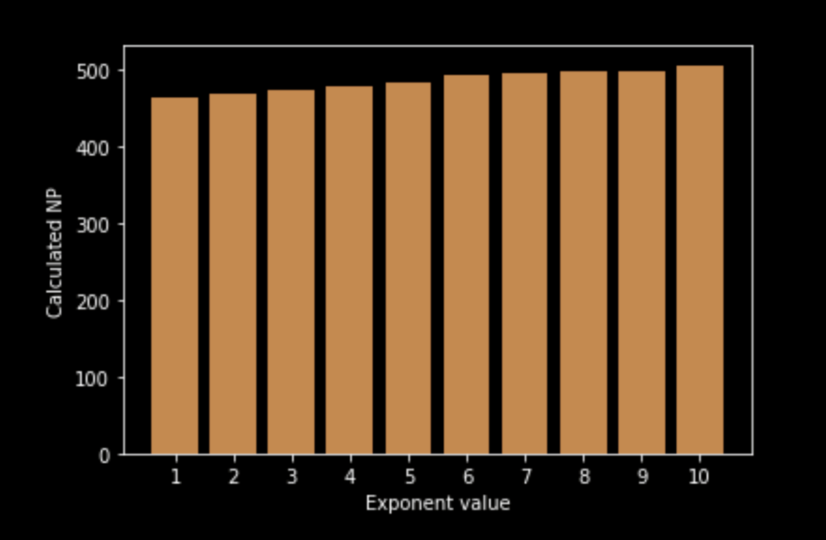
Changing the exponent: Now that we have changed the length of the time window, it’s time to change the exponent and see what happens. As you’ll recall from Step 2 of the normalized power calculation, we take the value over the time interval to the power of four and then take the fourth root in the final step. The question to ask is, why four? Why not two, three or five? Let’s put our time window back to 30s and change the exponent around and see what happens (we must remember to change both Step 2 and Step 4, so if we take the nth power, we must take the nth root in Step 4). This graph shows the calculated normalized power value using exponents in integer jumps from one to 10.
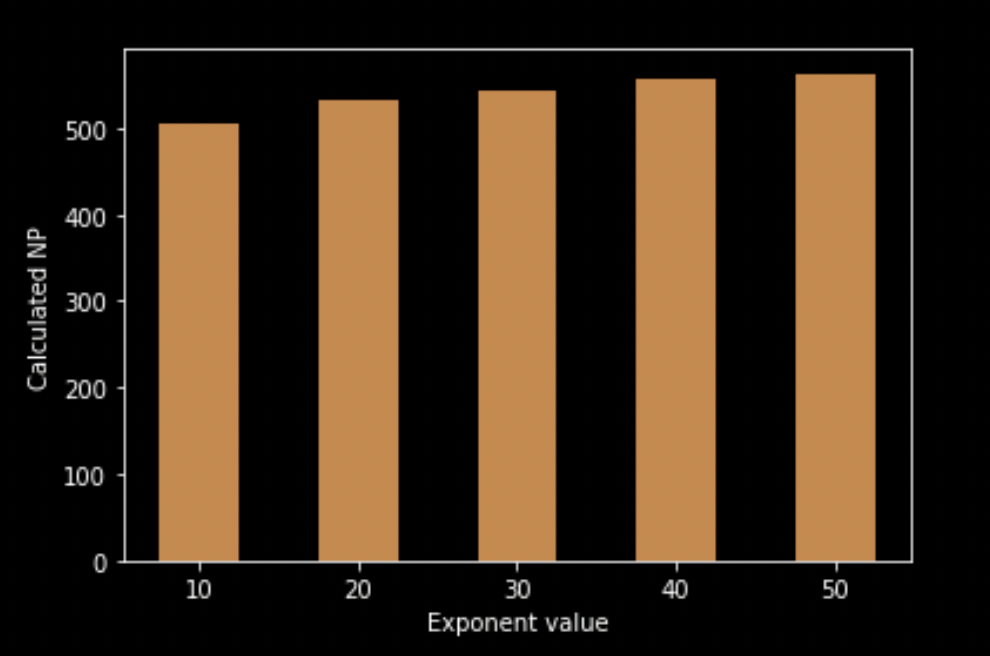
What happens if we go on much further than 10, perhaps in jumps of 10 up to 50? Doing this allows us to see the overall trend of changing this exponent. We see the value gradually increasing, but what happens if we carry on forever? Doing so involves some calculus and is probably beyond the scope of this blog post—potentially more appropriate for an academic journal. However, moving the exponent along a bit, what happens?
Our power increases onward. The exponent value for NP was used because it’s the one that best fits the population studied. It’s an approximation made to suit as much of the population as possible. There’s nothing inherently wrong with this; NP is a time-tested means of approximating the difficulty of a ride. But it’s worth remembering there’s an aspect of subjective choice involved in the values used for this formula. Coaches can use this information to recognize that some athletes are outliers, and the approximation is less valid for these athletes. Simply put, NP may underestimate the load on an athlete new to the sport but overestimate the load on a very well-trained athlete.
How A Coach Uses NP
From this article, we have investigated some of the strengths and weaknesses of NP as a metric. This investigation yields five key takeaways for coaches, they are:
- Coaches should carefully consider the metrics they look at depending on the specific context. This assessment applies to all TrainingPeaks metrics and others, such as HRV and athletes’ subjective self-assessment.
- When evaluating the ‘difficulty’ of a period in a race or ride over 10 minutes with high variability, then NP is appropriate. It is the best-known tool for the job.
- NP is also the best currently available tool for quantifying the overall load (or TSS), especially a ride with significant variability.
- Average power is more appropriate than NP on long climbs or during time trials. NP should not be used as a measure of judging performance.
- Looking at ‘time in zones” during interval sessions may be more pertinent. Both average power during intervals and average power across all intervals help judge whether the training session objectives were achieved.
Conclusion
The aim of this blog was not to have a go at NP for faulty math. Many of you are experienced coaches, and you know that NP is helpful to you. This post is to look under the bonnet of the calculations made and consider that they’re just that — calculations. NP is a highly valuable metric. In many scenarios, it can provide a better evaluation of the ride than average power. In other scenarios, it may not. Deciding when to look at Normalized Power and when to ignore is best made by trained coaches, as are other metrics available through TrainingPeaks. These decisions are most effective through coaches who understand NP in more depth, and I hope this post has provided some more understanding. Evaluating success in a specific context is more of an art than a science.

")


