
What is alcohol?
What are the risks?
“Dry Observations”
Correlations
Age-related alcohol considerations
Training with alcohol
Consider the celebrations like Memorial Day weekend in the United States, the Queen’s Jubilee celebrations in the United Kingdom and the Swannies putting one over the Mighty Melbourne Demons. There is a good chance someone — you? — overdid the beers, the Champagne, the wine and the spirits. No harm done, you might think. It may be true, yet sadly, that the former statement is completely wrong. The immediate effects of alcohol are well-known — hangovers. That state of fogginess, reduced motivation, breathlessness and general lethargy combined with the willpower of a gnat when it comes to making good decisions around nutrition the following day.
Let’s go beyond that immediate notion of why we believe alcohol may not be part of an effective training plan and look at what alcohol is, what are the risks, observations made whilst being “dry,” correlations, age-related alcohol considerations and finally, whether or not it can be part of an effective training program. Let’s dive in.
What Is Alcohol?
“Alcohol is a drug that can be toxic and addictive.” (1)
This was taken from the Australian Government website, leaving little doubt about what the officials think about alcohol. Alcohol is an ingredient in products such as beer, wine and spirits. It is the ingredient that impairs you and eventually gets you drunk if you consume too much of it. It is made by fermenting yeast with sugar from ingredients such as grapes (wine) and potatoes (vodka), for example.
Alcohol is often referred to as the “fourth macronutrient” as it supplies 7 Kcal of energy per 1g of alcohol. This means that alcohol, if you drink it, must be considered when factoring in caloric intake along with the negative health implications.
What Are the Risks of Alcohol Consumption?
Apart from the obvious involving falling over due to one too many, there are many serious implications of alcohol consumption. The interesting fact about alcohol is that the risks associated are not always related to heavy or excessive consumption when examining the risk of disease.
“In fact, in the last comparative risk assessment conducted by the World Health Organization (WHO), the detrimental impact of alcohol consumption on the global burden of disease and injury was surpassed only by unsafe sex and childhood underweight status but exceeded that of many classic risk factors, such as unsafe water and sanitation, high blood pressure, high cholesterol or tobacco use (WHO 2009). (2)

There is the cause-effect of alcohol with those disease processes directly caused by alcohol consumption, and these usually relate to excess consumption, such as Alcoholic liver disease or alcoholic hepatitis. George F. Koob, director of the National Institute on Alcohol Abuse and Alcoholism, estimates 200 medical conditions are worsened by alcohol, such as high blood pressure, stroke risk, diabetes, liver disease, and cancers, especially oral cancers. Quite often, we do not consider the longer-term effects of drinking alcohol and its effect on the body. Perhaps now is as good a time as any to do so. These are the bigger-picture risks. What about other shorter-term risks?
The causative negative effect of alcohol on sports-related injuries appears apparent, certainly in males and younger populations. This statistic may only reflect the fact that older populations in sports have not been studied to date. Increased incidence of injury is cited as being double that in drinking athletes compared to non-drinking athletes. This is postulated as potentially being due to the hangover effect, which could impair performance by as much as 11.4% (3)
You now know the long-term risk of disease and the moderate-term risk of injury, yet the primary concern may be the immediate effects and you want to know…
“Can I drink alcohol and still have an effective training plan?”
Dry Observations Made
The following are observations made across a four-month period that included one month of consuming alcohol, two months being “dry” and one month of alcohol. It is an N=1 observation yet also one that has correlated to many of the athletes that I work with, who have seen similar patterns occur. The data presented is taken from the Oura Ring and is not based on a clinical study or clinical measurement tools, although the validation of Oura continues to be made.
What was fascinating about this bit of self-experimentation was the immediate effect it had on subjective ratings of well-being — recorded daily in the Fuelin app — along with the physiological effects observed here in the following graphs.
Here we go.
Effect on Heart Rate Variability
Heart Rate Variability (HRV) is the measure of the variation in time between each heartbeat. Analysis of HRV offers a method of monitoring the readiness of your body from a neurological and physiological perspective. HRV is regulated by the Autonomic Nervous System (ANS) — the part of the nervous system that controls bodily functions such as digestion, blood pressure, heart rate regulation, and breathing. The ANS is broken into two subdivisions — the sympathetic (fight or flight) and the parasympathetic (relaxation) components.
Each plays an important role on a day-to-day basis and should be balanced based on stress and recovery. Theoretically, if stress, physical or psychological, is too high, then that can cause an overstimulation of the sympathetic system. This overstimulation in the sympathetic system has been observed to result in lower frequency in variation between heartbeats. Conversely, in individuals where relaxation and full recovery are observed, a higher frequency of variation between heartbeats occurs.
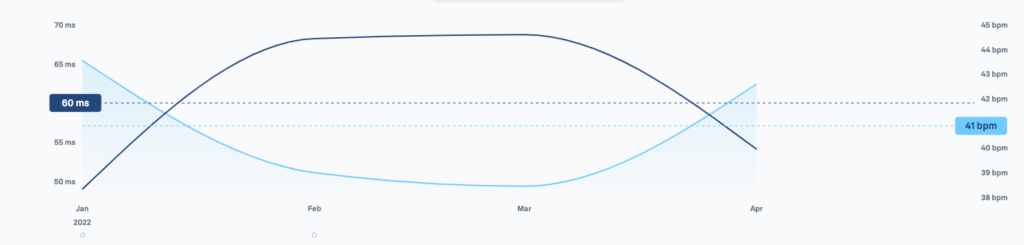
What you can see below is a clear increase in the HRV from the month of January to February and continuing within March. The drop-off in April coincides with the re-introduction of alcohol. These figures are averages across the months. Alcohol consumption was mostly limited to weekends and consisted of no more than four to five drinks in a sitting. The total drinks consumed would be less than 14, the maximum number of drinks recommended to be consumed in a week.
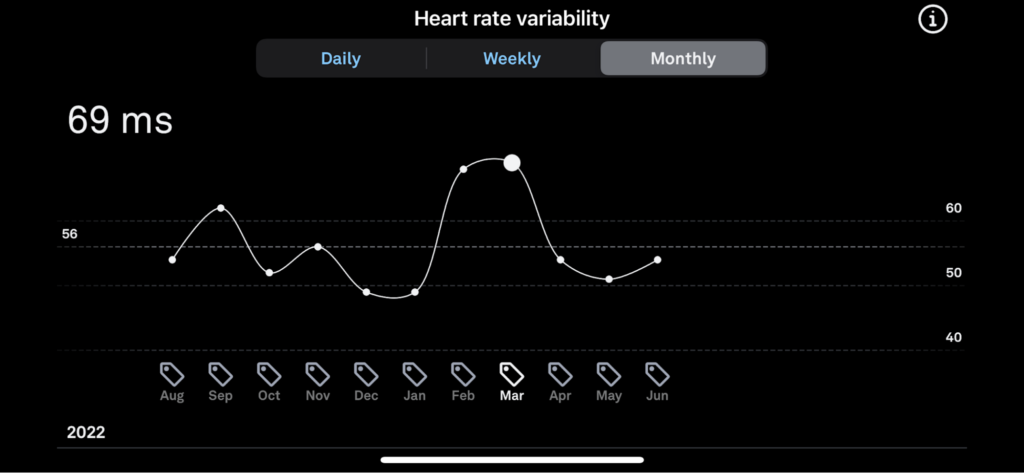
When reviewing the weekly recordings, there is a clear improvement week-to-week with a solid maintenance period before the decline begins to occur at the start of April.

Effect on Resting Heart Rate
Resting heart rate is regarded as one of the easiest and most effective ways of measuring your health. A lower resting heart rate is generally associated with improved physical fitness and associated with a lower risk of diseases such as high blood pressure, obesity, stroke and cardiovascular events such as heart attacks. As previously mentioned, the parasympathetic nervous system helps regulate heart rate and is associated with a relaxed state. As you can see in the graph below, resting minimum heart rate dropped considerably overnight when alcohol was absent from the diet. This was observed clearly in the weekly and monthly snapshots.
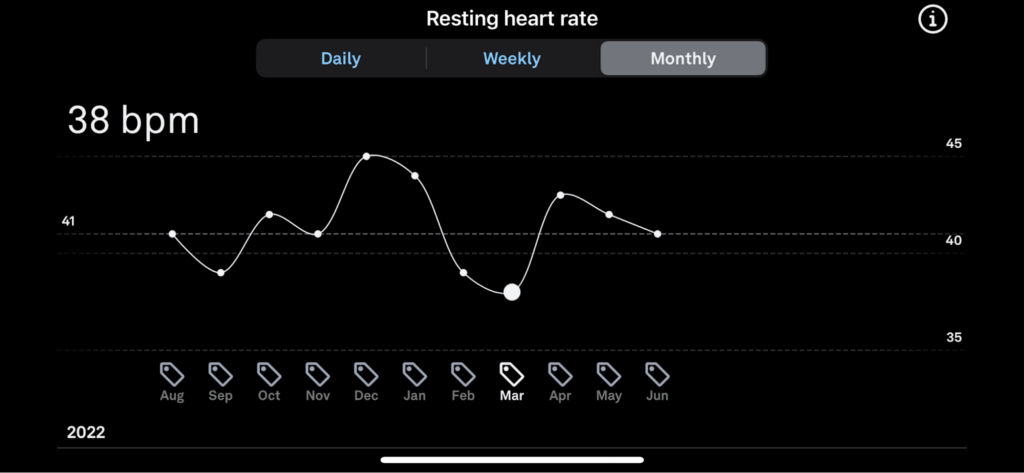

I will front this by saying I do have a fairly low resting heart rate, yet as you can see below, on the night I finished this experiment and had a rather enjoyable celebration dinner with my friends. The jump in resting heart rate from an average of 38 to 51 is quite staggering.

Sleep Metrics
I was very interested in what would happen to my sleep in terms of quality and quantity. From a purely subjective standpoint, I felt amazing. The ability to wake earlier, have more energy in the morning and have a much clearer thought process was very apparent.
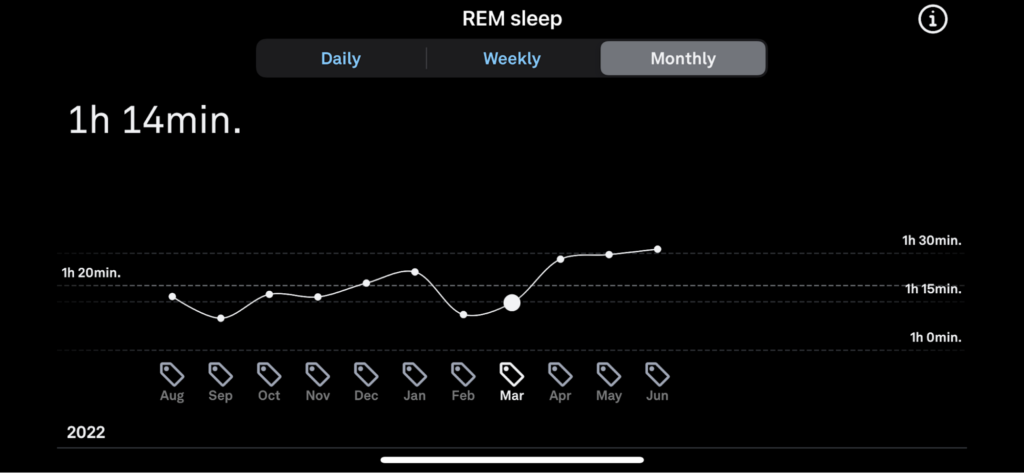
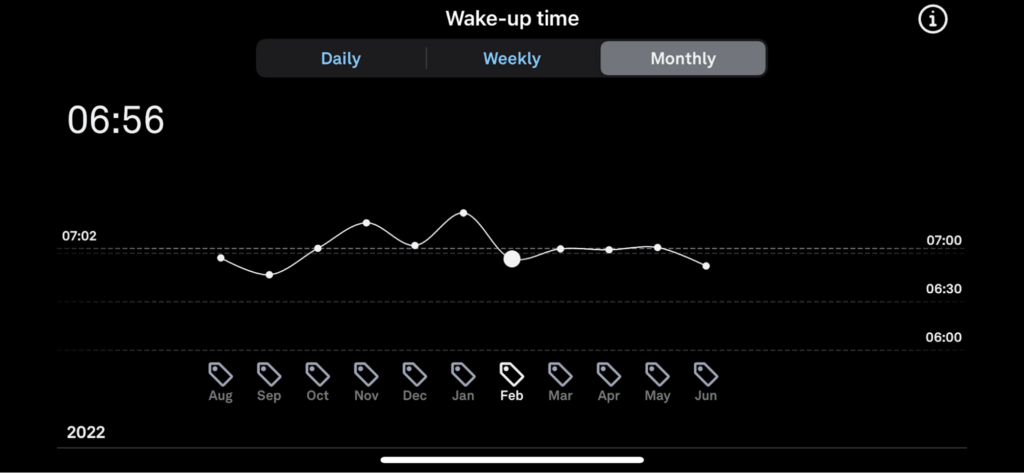
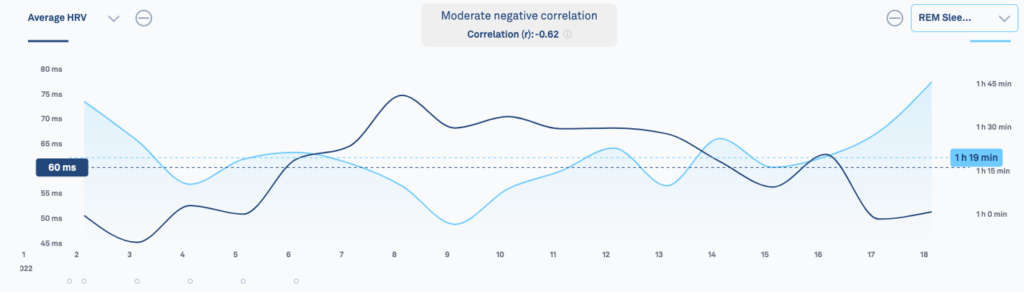
REM sleep duration actually dropped during the “dry” months, and the only reason I could explain this initially was due to an earlier wake-up time due to REM sleep generally occurring in the latter part of the sleep cycle. However, this bounced back fairly impressively once the “dry” period ceased but maintained the earlier wake-up time. Hard to explain this one, and I have not read anything to explain this phenomenon.
Deep sleep did, however, improve considerably and this part of the sleep cycle is typically observed earlier in the cycle. This coincided with my resting heart rate settling to its lowest point earlier in my sleep cycle. As you can see, the improvement was rather rapid and correlated with my subjective improvement in energy and clarity of thought.

CORRELATIONS
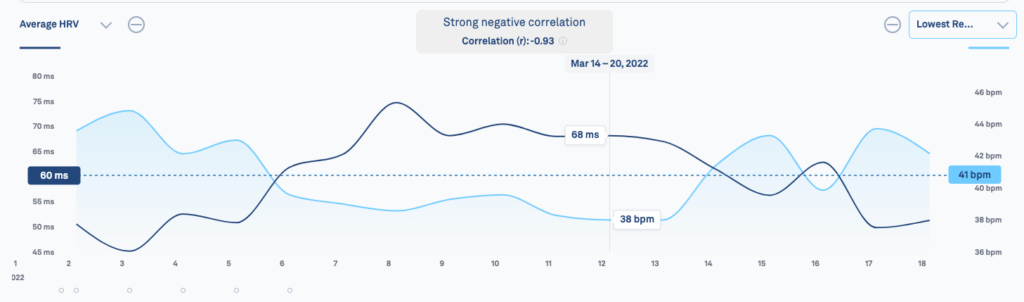
Now it is important to note that correlation is not causation. What was observed above is related solely to my physiology and the included graphs provide insight into the correlation between two markers within my body! Research does support the observations that alcohol will tend to cause an increase in heart rate, disturb an individual’s “normal” sleep cycle and adversely impact HRV readings. (4) Interestingly, as I did also discover, there is research supporting the notion that one drink will not affect heart rate or HRV, yet two drinks will. This could have implications for training individual athletes.
Graphs one through three reveal a strong negative Pearson Correlation coefficient in relation to average HRV and average resting heart rate and lowest resting heart rate. The middle block with the widening gap was when the “dry” period existed. This strong negative (inverse) relationship is viewed as beneficial, and the negative is only in relation to the two values moving in opposite directions as opposed to moving together.
This is explained on the Oura website. “The Pearson correlation coefficient helps you to investigate the relationship between two metrics. The coefficient ranges from -1 to 1: a value close to -1 or 1 indicates a strong correlation, whereas a value near 0 indicates no correlation. If the correlation is positive, the values increase or decrease together. If the correlation is negative, one value increases when the other decreases.”


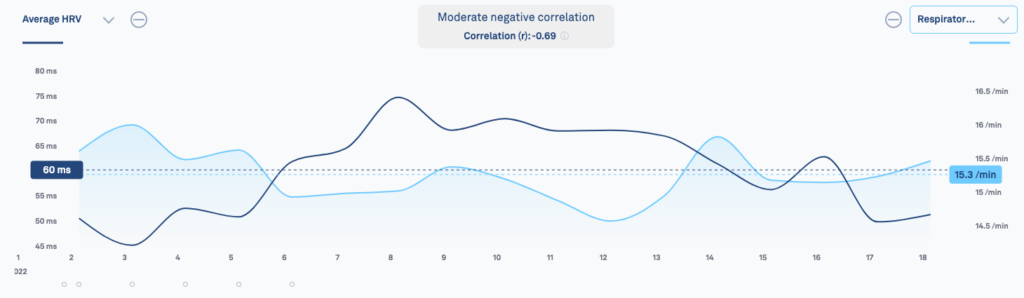
Although not mentioned previously, respiratory rate, which is controlled by the ANS, also showed a moderate negative correlation overnight with an increase in HRV, resulting in a reduced respiration rate. (Graph 5) This inverse relationship is regarded as a beneficial effect of reduced alcohol consumption with reduced mechanical exertion on the body being exhibited.
As previously highlighted, it was observed that as HRV went up, my REM sleep duration actually went down and a moderate negative (inverse) relationship was observed. (Graph 6) This was not a positive effect during the “dry” period and may have been explained by waking earlier and reducing the opportunity for REM to occur within my circadian rhythm. It did bounce back after the initial drop and settled back to the original baseline values after two months.
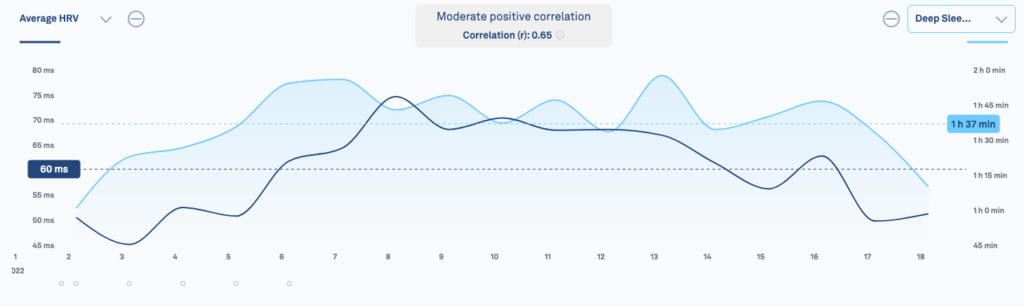
Deep sleep, on the other hand, showed a moderate positive (together) relationship where the increased HRV resulted in a longer duration of deep sleep being observed. Perhaps the ability to go into deeper sleep earlier is what resulted in the improved HRV rather than viewing it as HRV, resulting in improved deep sleep. The chicken or egg scenario exists. (Graph 7)
Age-Related Considerations
The above is relative to a 43-year-old male who is currently not training for a particular event yet lifts weights in the gym four times a week, swims twice per week for 40 minutes each session and runs an average of 60km per week. Total training time would be seven to eight hours per week. This may be a lot less than you or your average athlete trains in a week and could be a consideration as you see the marked effect alcohol can have on the body, and the relatively low training volume is negatively impacted through alcohol consumption.
It is also worth considering that age does impact alcohol consumption in a number of ways. Firstly, as we age, we gradually reduce the production of alcohol dehydrogenase (ADH). This is the enzyme that catalyzes the oxidation and subsequent reduction of alcohol and allows for its metabolism to occur. (5) This means that we become less efficient and effective at mopping up the alcohol in our bloodstream. It provides an insight into the question you may be asking yourself or your athletes, “Why can’t I handle alcohol like I used to?” Secondly, women produce less ADH compared to males, so they are at a disadvantage even in their youth which explains why women quite often have a lower tolerance to alcohol as well.
As we age, we also, unfortunately, can experience loss of muscle mass and with that whole-body water. This can have a negative impact on alcohol metabolism, along with the knowledge that we also have diminished thirst responses as we get older and are not always the best at recognizing when we are mildly dehydrated. These are all important considerations to acknowledge and consider when throwing a huge training load on top in the form of endurance programming.
Training With Alochol
So is it possible to have a solid training program and still consume alcohol… Sure? Will it be the most effective training program…? Unlikely.
The above examples related to HRV, heart rate, respiration, and sleep stages paint a picture of the negative impact alcohol could have on the parameters most often associated with recovery. If you think about the stress placed on the body through endurance training, then the recovery element of the training program becomes very, very important, and the way this is maximized may not involve alcohol at all.
One drink may not impact any of the parameters above, as highlighted in one study (6), yet the individual response to alcohol needs to be taken into consideration and metrics such as age and gender will influence this effect as well. Alcohol is one potential negative part of an effective performance protocol to consider. An effective performance protocol would also take into consideration the total nutritional intake, including total calories, macronutrient breakdown through grams per kilogram as opposed to a percentage of total calories ingested, food quality, nutrient timing, practical implications, palatability and finally, gut training.
All of these elements, when combined with the physical training component, are what will allow an athlete to excel. The consumption of alcohol will always be the athlete’s choice, and the decision to either drink or not drink will come down to how motivated that athlete is to follow the process to achieve their ultimate desires.
References:
- https://www.health.gov.au/health-topics/alcohol/about-alcohol/what-is-alcohol
- Rehm J. The risks associated with alcohol use and alcoholism. Alcohol Res Health. 2011;34(2):135-143.
- O’Brien, C.P., Lyons, F. Alcohol and the Athlete. Sports Med 29, 295–300 (2000).
- Ralevski E, Petrakis I, Altemus M. Heart rate variability in alcohol use: A review. Pharmacol Biochem Behav. 2019;176:83-92.
- Yin SJ. Alcohol dehydrogenase: enzymology and metabolism. Alcohol Suppl. 1994;2:113-119.
- Spaak, Jonas et al. “Dose-related effects of red wine and alcohol on heart rate variability.” American Journal of physiology. Heart and circulatory physiology vol. 298,6 (2010)


