
Why Objective Age-group Data Matters
One of the persistent challenges in triathlon coaching is knowing what “normal” training load looks like for age-group athletes. Coaches work daily with questions about weekly volume, progression, recovery, race preparation, and how much training is enough to help an athlete meet their objectives.
Yet despite the widespread use of training platforms and wearable technology, there has been surprisingly little objective, large-scale data available to help answer those questions with confidence.
That is what makes this recently published study important. Across six months, we analysed the training data of 95 age-group triathletes from 25 countries, comprising 34,731 individual training sessions and 2,177 training weeks.
Rather than relying on memory or self-reported estimates, the analysis drew on objective session data exported from TrainingPeaks, including duration, distance, heart rate, and Training Stress Score (TSS).
For coaches, the value of this kind of dataset is straightforward. It provides a more credible reference point for how age-group triathletes train in the real world and helps move decision-making away from assumptions and toward context.
More specifically, it gives coaches a practical benchmark. The goal is not to copy the averages from the study, but to use them as a starting point for better questions:
- Is this athlete’s weekly load broadly aligned with their race distance?
- Does their load match the phase of training they are in?
- Are they progressing appropriately, or are they carrying more or less load than expected for their current goals, experience, recovery, and life context?
Training Load Depends More on Race Goals Than Demographics
The first major finding was that training load was associated with race distance preference and training phase, but not with the athletes’ sex or age group.
In practical terms, this means the strongest drivers of weekly load were the event demands the athlete was preparing for and where they were in the training cycle (specifically, which phase of a periodised program).
Long-course triathletes carried higher weekly loads than short-course athletes, and the specific phase of training was higher than general training, Taper/Race/Post-race, and Off-season.
That distinction is important for coaches. The study suggests that training load should be interpreted primarily through the lens of race demands and training phase, rather than broad demographic assumptions.
Age and sex may still matter when coaching the individual athlete, but in this cohort, they were less predictive of overall weekly duration, distance, and TSS than what the athlete was training for and where they were in the season.
How Training Load Changes by Race Distance and Training Phase
In this cohort and across all disciplines (swim, bike, run), long-course athletes averaged 615 minutes of training per week, 171 km per week, and 574 TSS per week.
Short-course athletes, by comparison, averaged 507 minutes, 118 km, and 452 TSS per week. The Specific phase produced the highest loads, while the off-season was clearly the lowest. This aligns with sound coaching logic. The athlete’s preparation will likely become more demanding as specificity increases, then reduce strategically to support recovery, absorption, and performance.
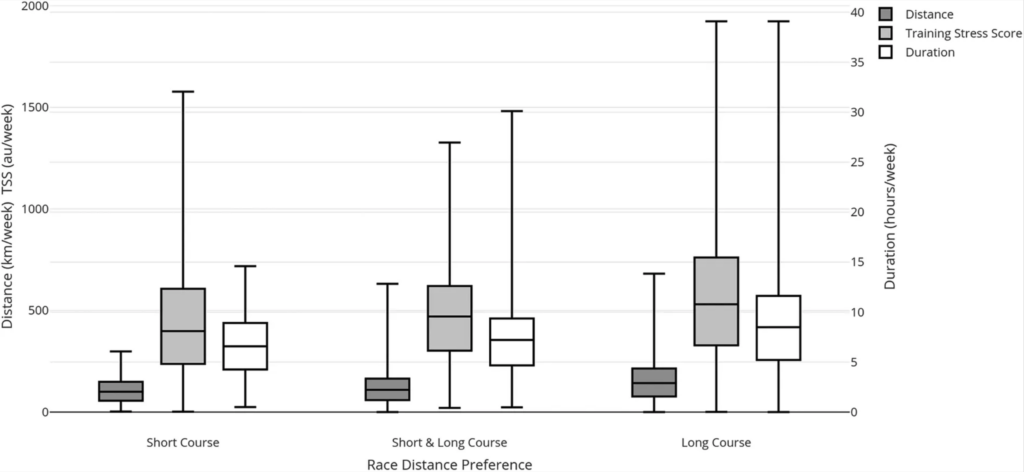
Note: all disciplines (swim, bike, run) added together.
One of the most useful practical details is the phase-to-phase pattern. Compared with the General phase, training load was approximately 21% higher in the Specific phase, 14% lower in the Taper/Race/Post-race phase, and 38% lower in the Off-season.
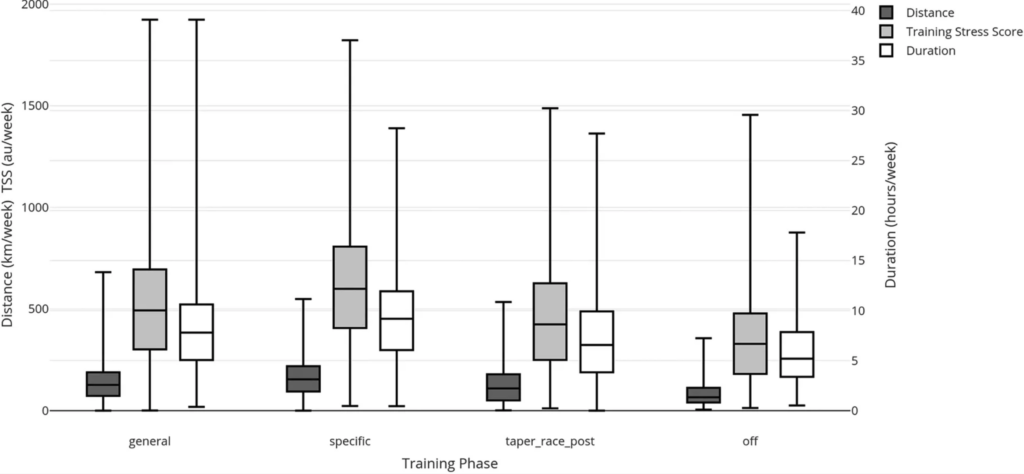
Note: all disciplines (swim, bike, run) added together.
These percentages should not be treated as universal rules, but they can help coaches sense-check whether an athlete’s progression and recovery periods are broadly aligned with real-world age-group training patterns.
For example, if an athlete’s load is continuing to climb deep into a taper, or if their Off-season looks nearly identical to their Specific phase, that may prompt a useful coaching conversation. The data does not prescribe the answer, but it can help coaches identify where the plan may need closer review.
What Did Not Differ Is Just as Important
Just as interesting were the findings that did not emerge.
Age and Sex Were Less Predictive Than Race Demands
Neither sex nor age group was significantly associated with total weekly duration, distance, or TSS in this cohort. That does not mean sex and age never matter in coaching. They do.
But it does suggest that, at least in this self-selected group of TrainingPeaks users, broad demographic categories were less informative than training phase and race distance preference for understanding overall weekly load.
For coaches, that is an important prompt. Rather than assuming younger athletes always train more, or that male and female athletes necessarily require materially different weekly loads, the evidence points back to more meaningful questions:
- What event is the athlete preparing for?
- What phase of training are they in?
- What load is appropriate for their current context, goals, experience, and broader life demands?
Weekly Heart Rate Averages May Miss the Details
The study also found that average weekly heart rate was not significantly associated with sex, age, race distance preference, or training phase.
That does not mean intensity never differs between sessions or phases. Rather, it may suggest that weekly average heart rate is too broad to capture the difference between easy aerobic work, intervals, race preparation, and taper sessions.
For coaches, this reinforces the need to look beyond weekly averages and examine session-level intensity distribution, workout purpose, and athlete response.
Strength Training Deserves Attention
The study also highlighted the role of strength training.
Most athletes reported including resistance training, typically twice per week for around 40 minutes per session, often during the general phase. That is encouraging, but the pattern also suggested that some athletes only include it for part of the year.
From a coaching perspective, that raises the familiar question of continuity. Strength training can support performance and reduce injury risk, but those benefits are best sustained with a consistent, purposeful approach rather than a short seasonal block.
The research makes this point even more clearly: athletes who strength train for only part of the year may lose some of those benefits by the time peak competition arrives.
Rather than treating strength training as a short General-phase add-on, coaches may want to maintain a periodised strength routine throughout the year, adjusting the volume and intensity around key training blocks and races.
Data Does Not Replace Judgment
There are, of course, limits to what any dataset can tell us.
This was a self-selected cohort of age-group triathletes who use TrainingPeaks and were willing to provide six months of data. It is not a perfect representation of every age-group athlete. Nor do these training load measures capture everything that matters about training response, adaptation, or life stress.
It is also important to understand what TSS can and cannot tell a coach. In this study, TSS was treated as a training-dose metric: a way to quantify the amount of training completed. It does not directly measure how well an athlete absorbed that work. Coaches still need to interpret load alongside subjective feedback, readiness, sleep, HRV, resting heart rate, mood, soreness, performance trends, and broader life stress.
But those limitations do not diminish the practical value of the work. If anything, they reinforce the need for coaches to use data as part of a broader judgment process rather than as a substitute for coaching.
That is the key takeaway.
Context Remains the Centre of Good Coaching
That word — context — is central.
Good coaching has never been about copying elite programs or chasing arbitrary numbers. It is about matching load to event demands, readiness, experience, and the athlete’s broader life – work, study, family, keeping an interest in other hobbies, or maintaining a social life outside of training.
What this study offers is not a rigid prescription, but a more useful frame of reference. It helps coaches ask, with greater precision, whether an athlete’s training load is broadly in line with that of comparable-age triathletes.
How Coaches Can Use This Data
For coaches, the practical value of this study comes from how the data can inform better conversations and more defensible programming decisions. Coaches can use the findings to:
- Compare an athlete’s weekly load against similar age-group athletes.
- Evaluate whether training load aligns with race-distance demands.
- Check whether load is progressing appropriately from General to Specific training.
- Use the 21% increase, 14% reduction, and 38% reduction across phases as broad reference points, not rigid rules.
- Avoid assuming that age or sex alone should determine total weekly load.
- Look beyond weekly averages and examine session-level intensity, recovery, and athlete response.
- Treat TSS as a measure of the training dose applied and training completed, not proof that the athlete is adapting well.
- Maintain strength training more consistently throughout the year instead of limiting it to a short seasonal block.
The broader coaching implication is that effective triathlon programming is likely best shaped by race demands, training phase, and individual athlete context, not by demographic assumptions or generic volume targets.
As coaching continues to become more data-rich, the challenge is no longer access to numbers; it is the interpretation of those numbers. It is knowing which numbers matter, how to interpret them, and how to translate them into better decisions.
Objective datasets like this can help. They provide a stronger benchmark, a clearer context, and a more defensible starting point for coaching conversations.
In the end, that is where sport science evidence is most valuable: not in replacing the coach, but in sharpening the quality of coaching judgment.
References
Wells, Leighton A., et al. (2026, April 29). Training load and intensity in triathlon: objective differences between sex, age, race distance preference and training phase across a cohort of 95 age-group triathletes over six months. Retrieved from https://www.frontiersin.org/journals/sports-and-active-living/articles/10.3389/fspor.2026.1798702/full


")
