
What is Heart Rate Variability?
Heart rate variability (HRV) is a method for assessing the effects of stress on your body. It is a measurement of the time gap between your heartbeats that varies as you breathe in and out. Research increasingly shows that high HRV indicates good health and a high level of fitness, while decreased HRV is linked to stress, fatigue and even burnout. HRV is a holistic measure of total load, i.e. it reflects the impact of multiple sources of stress on the athlete, not just training, but sleep, nutrition, mental and emotional stress.
The idea behind using HRV in training is quite simple: monitor your HRV every morning and train as normal. If your HRV drops significantly, take this as an early warning that you may be overloading the system. A small drop is normal as long as you recover because training is, after all, about stress and recovery. A hard session, especially on top of accumulated fatigue, will lower your HRV.
HRV that remains out of an athlete’s normal range (both high as well as low) despite reduced training loads has been shown in research to be a sign of Non-Functional Overreaching.
There are a number of apps available to measure HRV in athletes, but only a few have been independently validated for accuracy. Since HRV involves precise measurements on each heartbeat, the sensor used must also be validated as suitable for HRV. There are a few chest straps (e.g. Polar and Wahoo) and finger pulse sensors that have been shown to be sufficiently accurate.
What was the new research?
There have been a couple of studies that show incorporating HRV into your training plan may be significantly better than a standard program in terms of improving performance of club and recreational runners. Now, a new study by researchers from the Sport Research Centre of Miguel Hernandez University in Alicante, Spain and the University of Stellenbosch in South Africa have shown very promising results in road cyclists, too.
Seventeen well-trained cyclists were recruited, with an average age of 39 years and riding experience of 13 years. Their average 40-minute time trial power (approximately their FTP) was 220 watts.
As seen below, performance was measured three times over the period of the study: 1) at the beginning, 2) after 4 weeks of baseline training, and 3) after 8 weeks of guided training. For the last period, the group was split into HRV-guided and traditional (coach prescribed) training.
- Evaluation week
- 4 Baseline weeks (common)
- Evaluation week
- 8 Training weeks (HRV guided/Traditional)
- Evaluation week
HRV was measured by the cyclists at home every morning with a Polar H7 chest strap, and the heartbeat data was analyzed by the researchers using lab software. From this, a 7-day moving average of HRV was calculated. During the four baseline weeks, participants performed about eight hours of training per week, during which the mean and standard deviation of the HRV measurements were calculated for each cyclist. This produced thresholds for the HRV-guided training weeks that followed.
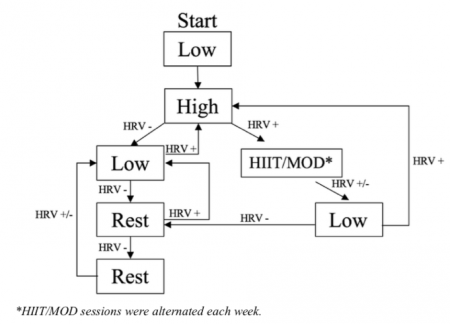
During the actual 8-week training phase, an algorithm based on an earlier HRV-guided study with runners was used. The original daily guide was modified with tweaks to include HIIT, threshold days, and low-intensity training, and included rotations to avoid monotony. The practical outcome of this was a distribution of 66/24/10 percent in the three low/moderate/high intensity zones, respectively.
For the group performing the standard plan, time spent in each zone was very similar to the HRV-guided group (64/27/9 percent), but with a fixed rotation that did not depend on the cyclist’s HRV for that day.
Both groups spent an average of 9 hours training each week during this phase.
Were there new findings?
The major finding of this new study was that HRV-guided training led to substantially greater increases in peak power (5 percent), power at VT2 (14 percent), and power over the 40-minute time trial (7 percent) compared to traditional training, where the peak and 40-minute time trial power hardly improved at all.
When looking at the ranked change in performance on the 40 min TT, it is clear that HRV-guided training produced many of the best (4 of the top 5) and avoided the worst (1 of the bottom 3) results:
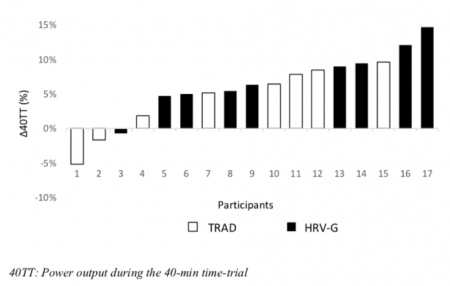
The variation in HRV during the training phase was also much smaller in the HRV-guided group.
How do I use this as a coach?
A key difference between this research and some earlier studies on HRV-guided training is that the weekly average is used, as opposed to the daily HRV score. This places a greater emphasis on accumulated fatigue over the short term, and is analogous to Acute Training Load (ATL). The difference between the two is the fact that internal load is being assessed rather than external load with ATL and Training Stress Score (TSS).
For example, the typical pattern of the HRV 7-day moving average can be seen in this example from a high-level endurance athlete:
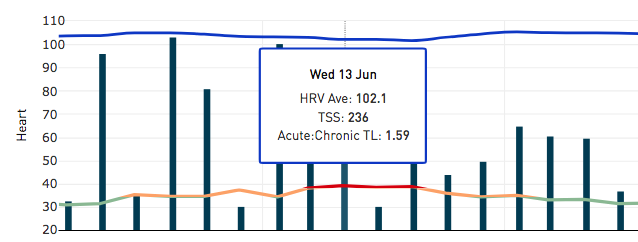
At the start of a period of intensified training, the HRV 7-day average (often called the HRV baseline), is about 105 (20xLnRMSSD). Peak daily training loads were up to 270 TSS, and you can see the Acute: Chronic TL ratio headed up towards 1.6 on June 13. At the same time, the HRV 7-day average is declining, reaching 102 on that day.
Daily TSS is reduced on June 14 and June 16, and then the HRV 7-day average start to rebound. On June 18 the average has reached a level higher than at the start, likely indicating that adaptation has produced performance gains.
This is the principle used in the study’s algorithm. In very simple terms, pile on the load until the HRV 7-day average starts to decline, then back off either with rest or low-intensity sessions until the HRV 7-day average rebounds. The amount of training load required will depend on the athlete, and, in most cases, the dip will happen sooner and be sharper than that shown for the elite athlete in the example above.
Practical tips
- Watch out for dips in the 7-day moving average. There is not an automated version of this algorithm yet, but you could use a 1.5 point drop of 20xLnRMSSD (corresponding to a 7.5 percent drop in raw RMSSD) to trigger the switch from intense to low-intensity training. Athletes can watch for these changes, as well. For the spreadsheet-minded, you can calculate the standard deviation of the HRV 7-day average and take 0.5 SD as the smallest worthwhile change (SWC) and the threshold for switching.
- Have the athlete take at least four to five readings per week. Unlike driving each session from the daily HRV, the HRV 7-day average does not need a daily reading. Four to five readings every week are sufficient, but athletes should be encouraged to take an HRV reading after every training day.
- Good measurement practice is important. Although using the HRV 7-day average smooths out daily variations, good measurement practice will increase the sensitivity of the metric and produce better results. Here are a few pointers:
- Take the measurement first thing after waking to avoid effects of caffeine, food and mental stress,
- Adopt a consistent position such as sitting or standing for elite athletes with low resting heart rates,
- Use apps and sensors that have been independently validated for accuracy,
- Encourage athletes to record subjective metrics and comments for context. These are very useful in making lifestyle changes that benefit the athlete’s health as well as performance.
- Avoid robotic monotony. Even if the athlete’s HRV 7-day average stays high, introduce some variation to reduce monotony. This approach is shown in the flowchart of the algorithm, where HIIT and moderate sessions were alternated each week.
- Don’t train hard when sick. Common sense should still prevail. If the athlete is sick or has a large decline in daily HRV then rest is still the best option.
Prescribing training based on HRV 7-day average produced better results in this study on well-trained endurance cyclists. Wider adoption will reveal whether this also applies to more recreational and elite-level athletes.
Practical tips
- Watch out for dips in the 7-day moving average. There is not an automated version of this algorithm yet, but you could use a 1.5 point drop of 20xLnRMSSD (corresponding to a 7.5 percent drop in raw RMSSD) to trigger the switch from intense to low-intensity training. For the spreadsheet-minded, you can calculate the standard deviation of the HRV 7-day average and take 0.5 SD as the smallest worthwhile change (SWC) and the threshold for switching.
- Have the athlete take at least four to five readings per week. Unlike driving each session from the daily HRV, the HRV 7-day average does not need a daily reading. Four to five readings every week are sufficient, but athletes should be encouraged to take an HRV reading after every training day.
- Good measurement practice is important. Although using the HRV 7-day average smooths out daily variations, good measurement practice will increase the sensitivity of the metric and produce better results. Here are a few pointers:
- Take the measurement first thing after waking to avoid effects of caffeine, food and mental stress,
- Adopt a consistent position such as sitting or standing for elite athletes with low resting heart rates,
- Use apps and sensors that have been independently validated for accuracy,
- Encourage athletes to record subjective metrics and comments for context. These are very useful in making lifestyle changes that benefit the athlete’s health as well as performance.
- Avoid robotic monotony. Even if the athlete’s HRV 7-day average stays high, introduce some variation to reduce monotony. This approach is shown in the flowchart of the algorithm, where HIIT and moderate sessions were alternated each week.
- Don’t train hard when sick. Common sense should still prevail. If the athlete is sick or has a large decline in daily HRV then rest is still the best option.
Prescribing training based on HRV 7-day average produced better results in this study on well-trained endurance cyclists. Wider adoption will reveal whether this also applies to more recreational and elite-level athletes.

