Normalized Graded Pace (NGP) is the adjusted pace reported from a global positioning system (GPS), or other speed/distance device, that reflects the changes in grade and intensity that contribute to the physiological cost of running on varied terrain. Although it is fairly common nowadays for triathletes and runners to track training intensity by time and heart rate, this is a fairly recent phenomenon. For decades, if not centuries, runners have been tracking training load and intensity primarily based on distance and pace. Many, if not most, elite distance runners, primarily track training load by tracking mileage and/or pace. This has traditionally been performed simply by logging time and distance for the entire workout, but for specific speed work or hard workouts on open terrain, this is less than optimal.
For that reason, quality speed work (where accurate intensity measures are important) is typically performed on a track. Conversely, and maybe more importantly, recovery runs are typically performed on open varied terrain. Because recovery may be equally as important as hard training for optimal performance, some athletes may be overdoing it on recovery runs without their, or their coach’s, knowledge. With the recent introduction of global positioning system (GPS) devices for use by fitness enthusiasts and athletes, though, the quantification of training load and intensity on open field runs is much more practical. Certainly, we can derive NGP from flatland running, such as on a running track, but NGP really shines when applied to pace data obtained on undulating or even hilly terrain.
Some readers, who come from cycling background and have used power meters, may recognize the similarity in name of NGP with Normalized Power (NP) from cycling. It is true that the inspiration for NGP came from the work of Andrew Coggan, Ph.D. and his development of NP. For coaches and/or athletes who participate in multi-sports, and have used NP and Training Stress Scores (TSS) for cycling, there has been a great desire to extend the principles and utility of the NP/TSS system to other disciplines. The obvious first extension that comes to mind is running. The recent availability of downloadable GPS recording devices makes the adaptation of the NP/TSS system to running an attractive proposition.
For those of you who may be reading this though, and have not been exposed to the principles of cycling powermeter usage, a little background is in order so that gaps in knowledge are avoided as we move into the discussion of NGP as derived from principles established in cycling.
A NP/TSS Primer
An in-depth discussion of the concepts of NP and TSS can be found here. In brief though, for cycling, NP is the calculated power based on power meter measurements that are adjusted for the metabolic cost of a given exercise bout. These adjustments are based on the exponential relationship between power output and some physiological responses that are indicative of the physiological strain of an exercise bout. In other words, some physiological parameters (e.g. glycogen utilization, catecholamine (epinephrine) levels, ventilation, lactate accumulation) exhibit an exponential response to increasing workloads or power output. In particular, most individuals, even if not trained in Exercise Physiology, are familiar with the exponential response of blood lactate to exercise intensity (Figure 1), and it is this response we use to derive the lactate threshold from an incremental exercise test.
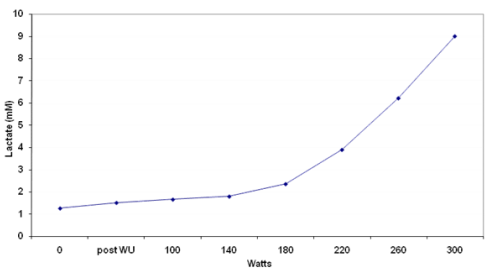
Lactate threshold curve during incremental cycle ergometry test. From this figure we can see that as we increased workrate at low intensity (e.g. 100-140 watts), the lactate increase increases minimally and appears to be linear. In contrast, as workrate is increased at higher intensity (e.g. 220-260 watts), lactate increases more substantially and the change appears to be exponential. It should be noted that across intensities, the change in lactate *production* within the muscle is exponentially related to workrate, but this is simply not clearly evident in blood lactate measurements at low intensities. The exponential relationship becomes clearly evident at higher workrates, above the “lactate threshold”.
One might argue that physiological variables, such as HR, exhibit a linear response to increases in workrate, and that’s why we can use HR as a “ball park” estimator of exercise intensity. It is true that HR exhibits a linear response to increases in workrate for the most part, but many, if not the majority of physiological variables exhibit an exponential response, and the exponential responses of parameters such as lactate, epinephrine and, most importantly glycogen, are indicative of the “strain” of an exercise session. Potentially more important is that despite the fact that HR response is linear with increases in workrate, this response is exhibited only up to VO2max. That is, because our VO2max is limited to a large extent by our cardiovascular systems ability to pump blood, and hence HR, once we reach that limit, HR no longer responds to increases in intensity. So, if one performs any work above their VO2max, it is not reflected by HR at all.
Therefore, it is not possible to account for the exponential response of many of these parameters at higher exercise intensities using HR as the measure of intensity. This is part of the reason power measurement is such a valuable tool to plan for, and evaluate, the intensity of a workout in cycling; one gets a more accurate measure of the work being performed, and can more effectively predict the strain being elicited as a result. So, NP takes this into account and weights the metabolic cost of increased power output exponentially, resulting in a “physiologically relevant” estimate of the actual cost of an exercise bout. This is of great value due to the stochastic (apparently random) nature of many types of efforts and events in cycling. For example, if one were to ride in a hard road race that resulted in an average power of 200 watts for the duration of the race, one might think that was an unrealistic estimate of the actual nature of the effort. On the other hand, the normalized power might be 300 watts for the race, and it likely would be that 300 watts would be more realistic from the rider’s perception, and the actual metabolic cost of the effort. So, NP uses the raw power data to calculate a more physiologically relevant estimate of the effort based on several parameters, the primary being, the exponential relationship between lactate accumulation and exercise intensity.
At this point, if you are a runner, you may be asking yourself, how does this all relate to me? Well, first of all, power is the cycling analog of pace in running. In fact, if we plotted power vs. pace at a constant speed, for a given runner, there would be a very close relationship; they change proportionally. So, if you are a runner, and you track training based on pace, you are indirectly tracking power. Although, it is very difficult for us to exactly determine the power an individual produces when running, in a laboratory under controlled conditions, it is clear running speed is proportional to power. Of course, in the field, factors such as wind resistance, terrain, economy, etc. confound our efforts to exactly determine the power an individual produces. But what this all really means is the physiological parameters that respond exponentially to power in cycling also respond similarly to pace in running. So, the underlying principles of NP in cycling hold for what can be termed Normalized Graded Pace (NGP) in running.
Normalized Graded Pace (NGP)
As previously stated, the original inspiration for NGP came from NP and its use in cycling. For those who do not come from a cycling background, the power outputs in cycling can be very stochastic, or seemingly “noisy”, making interpretation of many types of efforts (e.g. races) very difficult. NP though, is quite useful in attenuating the apparent noise of the effort and providing the athlete/coach with useful information about the effort. In the case of running, the efforts are typically not as noisy as many in cycling, but measurement of efforts using a technology such as GPS still poses substantial challenges. The primary challenge is that we are measuring the external pace which results from not only the physiological exertion, but changes in grade and biomechanical factors contributing to economy. The clear example of this would be to compare two efforts for the same runner; one run on a flat surface such as a track, and the other run on a hilly route, with many feet of climbing and descending. In the first case, if the individual ran 5 miles on the track at an average pace of 6:00 min/mi, we can be reasonably certain, that the physiological cost of that run equated to other efforts on flat terrain run at a 6:00 min/mi pace. On the other hand, for the run on a hilly route, where the individual ran 5 miles at an average pace of 6:00 min/mi, we don’t really know if that run was easier or harder than the flat run. The pace was the same, but depending on how the hills affected that pace, the 6:00 min/mi pace might actually be more akin to a 5:45, or even 5:30 pace. On the other hand, it could have been more like a slower run, say a 7:30 pace. That is, the physiological costs of the run are not reflected very accurately in the “raw” average pace. So, to find a physiologically relevant pace, we need to adjust the pace taking into account changes in grade, that interact with pace, and result in greater or lesser cost at a given speed.
Now, let’s look at a real example to demonstrate the utility of NGP with regard to evaluating the physiological impact of running efforts. In Figure 2 we can see the downloaded workout of a female triathlete performing an “LT” interval session on the open road. For this athlete, the target pace was 6:50-7:00 min/mi and her functional threshold running pace is 6:55 min/mi. She performed five intervals of increasing duration (~2, 4, 6, 8 and 10 min) at this target pace according to her GPS unit. The relevant parameters (e.g. pace, grade, NGP, HR) for all intervals are displayed in Table 1. If we first look at interval #1 and #2, we immediately see one of the limitations of using HR as a criterion of intensity during short, hard efforts. Despite the fact that these two intervals were run at a similar effort level, HR does not respond completely by the end of the first interval, and lags substantially in the second. Even though these intervals were performed at a pace that corresponded closely to the athletes “threshold”, which is a quasi-state state circumstance. The average HR was substantially lower than would be expected during sustained efforts at “threshold” and never reached steady state during either of these intervals.
(As a side note, threshold is in “ “ due to the fact that there are many definitions of a “threshold” in the popular training literature, and the definition used by this athlete may not be entirely appropriate. A more extensive discussion of how to define your running threshold pace, what we will call functional threshold pace (FTP) for the purposes of rTSS determination can be found here).
In Figure 2, the dotted yellow lines indicate the trend of HR for each interval. It can be seen that for the first two intervals, HR trends upward steeply and does not reach a steady state. On the other hand, raw pace was very close to the target pace, and NGP adjusted for grade and intensity, was slightly faster, but indicative of the perceived effort. On intervals #3 and #4, HR “drifts” upward after reaching a quasi-steady state. This indicates, for these longer efforts, that the pace was close to FT pace, but maybe a bit fast, and this is reflected in the calculated NGP. In the case of interval #5, we can see that the average “raw” pace and average HR were similar to the earlier efforts, but the grade is negative (downhill), as opposed to slightly positive in the earlier efforts. We might expect that an effort run downhill at the same speed as efforts run uphill would be less stressful physiologically, and therefore “easier”. We can see that the NGP reflects this in that it is slower than the average raw pace, indicating less metabolic cost of the effort. Although the average HR was comparable to the previous two efforts, it can be seen that at the steepest downhill portion of the effort, the HR drops substantially (identified by yellow circle), providing external confirmation that the overall effort was easier than previous efforts run at essentially the same pace as reported from the GPS unit.
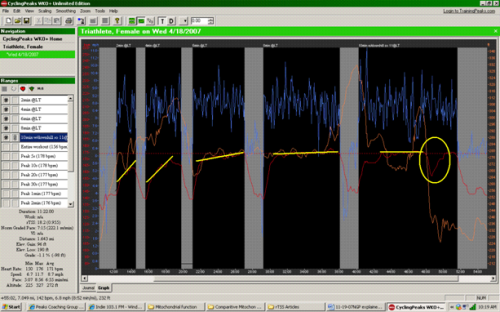
Figure 2. Top: Intervals run at pace corresponding to perceived “LT”.
| Interval 1 | Interval 2 | Interval 3 | Interval 4 | Interval 5 | |
| Duration (min:sec) | 2:17 | 4:09 | 6:01 | 8:49 | 11:22 |
| Raw Pace (min/mi) | 7:01 | 6:57 | 6:45 | 6:53 | 6:55 |
| Grade (%) | 0.8 | 0.5 | 0.2 | 0.2 | -1.1 |
| NGP (min/mi) | 6:40 | 6:36 | 6:36 | 6:45 | 7:15 |
| Max HR (bpm) | 163 | 170 | 175 | 178 | 176 |
| Ave HR (bpm) | 157 | 161 | 169 | 172 | 171 |
Table 1: Performance and physiological parameters corresponding to intervals in Figure 2.
Let’s look at another example from the same individual on a different run ( Figure 3). In this case, the triathlete is running on a route that is primarily uphill for the first part of the run. For this segment (highlighted in Figure 3b) the average pace was 8:59 min/mi. Since the athlete was running uphill though (+1.1 % grade net elevation gain), the metabolic cost was greater than what we would expect from an 8:59 min/mi pace and this is reflected in a NGP of 8:21 min/mi. On the other hand, in the second segment (highlighted in Figure 3c), where she is running downhill, the average pace is 8:32 min/mi. Again, since she is running downhill (-1.3% grade net elevation gain), the metabolic cost is less than would be expected from an 8:32 min/mi pace, and this is reflected in the 8:52 min/mi NGP.

Figure 3a.

Figure 3b.

Figure 3c.
Bear in mind that that not only changes in grade are used to calculate the physiologically relevant pace of NGP. As with NP in cycling, an exponential weighting step is utilized that is based on the relationship between intensity and lactate accumulation. So, not only is the NGP faster than the raw reported pace as a result of a positive grade, in some circumstances, an effort that has a component above the “threshold” will result in a more metabolically costly effort than indicated by the raw pace.
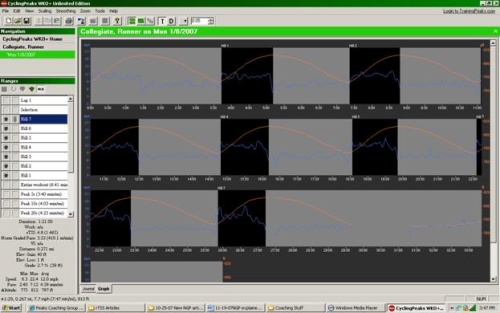
Figure 4. Top: Hill intervals performed by collegiate runner at approximately mile pace.
| Hill 1 | Hill 2 | Hill 3 | Hill 4 | Hill 5 | Hill 6 | Hill 7 | |
| Duration (min:sec) | 1:28 | 1:26 | 1:23 | 1:22 | 1:17 | 1:17 | 1:21 |
| Raw Pace (min/mi) | 5:25 | 5:16 | 5:18 | 5:05 | 4:58 | 4:50 | 4:59 |
| Grade (%) | 2.8 | 2.8 | 2.9 | 2.9 | 2.9 | 2.8 | 2.7 |
| NGP (min/mi) | 4:42 | 4:26 | 4:26 | 4:20 | 4:07 | 3:58 | 3:55 |
Table 2. Performance parameters corresponding to intervals displayed in Figure 4.
The final example is of a collegiate distance runner (Figure 4; Table 2). In this case, the athlete is running short hill intervals at slightly faster than mile pace, which is 4:25 min/mi for this individual. Each of the intervals (labeled Hill 1-7) are run between 1:17 and 1:28 in duration on grades between 2.7 and 2.9 %. These repeats were run on the same hill, but depending where the interval ended, there will be some variability in calculated grade. As can be seen from the “raw” GPS pace, all efforts were slower than this athletes mile pace when uncorrected for changes in grade and accounting for intensity. On the other hand, the NGP calculations result in six of the seven repeats being run at mile pace or faster. In this case, the athlete was not using a GPS unit that recorded HR, but, regardless, for efforts of this duration and intensity, HR would be essentially useless from a pacing, or intensity estimate standpoint. Pace, and more specifically NGP, is clearly the superior approach to track training intensity in this example.
So, now the athlete and/or coach have a means of assessing exact training load on open field runs. That is of great value in and of itself, but for those of you who are familiar with the performance modeling approaches (Performance Manager; PMC) made possible by the NP algorithm in cycling, you may also see the potential value in using NGP to calculate a training stress score for running (rTSS) to enable performance modeling for running and/or multi-sports like triathlon. If you are not familiar, or want to learn more about rTSS and performance modeling for running using the NGP approach, information can be found here.