At the IRONMAN World Championships, athletes push their limits to achieve their goals. Here are five of the best power files we have seen from professionals and age group athletes.
Craig Alexander’s Win in 2011

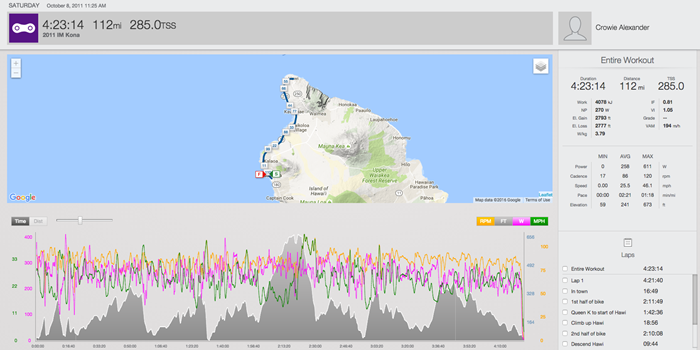
View Alexander’s full power file.
- Alexander kept things very much under control at the start. His Intensity Factor® (IF®) was only .82.
- Climbing Hawi, he bumps up his wattage by 28 watts for the nearly 19 minute climb.
- Showing good pacing, Alexander’s watts for the 2nd half of the bike are only 10 fewer than the 1st half.
- Overall, this is a perfect power file for an IRONMAN bike. Alexander’s Variability Index (VI) is 1.05 and his IF is .81.
- For the ride, Alexander averaged 25.5mph and 86rpm with a Normalized Power® (NP®) of 270 watts.
Pete Jacobs’ Win in 2012
- Pete came out of the water with the front group that included Frederick VanLierde and Luke McKenzie.
- Luke took the lead and brought the group up to leader Andy Potts. Pete stayed in 3rd place through the first 45 miles then made his move to the front. During this move he maxed out at 578W – enough to power a freezer.
- From T1 to the turn around he stayed in the top 5 and maintained 298W, or 4.3 w/kg (83% of his FTP) for over 2 hours. Amazingly, he was able to maintain a relative high average of 265W 93.8 w/kg) on the ride back to T2 and was 2nd off the bike.
- Coming down Hawi, riding a 54 tooth front chainring forced Pete to “spin out” at 120 rpm. He lost some position to riders with 55 tooth chainrings but put in a 300W effort for 10 minutes to stay at the front.
- With the fastest marathon times in the previous two years, Pete put himself in a great position starting the run.
- Ironman athletes can expend 8,000 to 10,000 calories during the race, roughly 1,000 cal/hr. At the high end of what the human body can absorb, they may consume about 400 cal/hr on the bike. Pete burned approximately 4900 calories on the bike. Add in about 1000 calories for the swim with no calories taken in, we estimate that he was at a 4100 calorie deficit heading out on the run.
Ben Hoffman’s 2nd Place in 2014

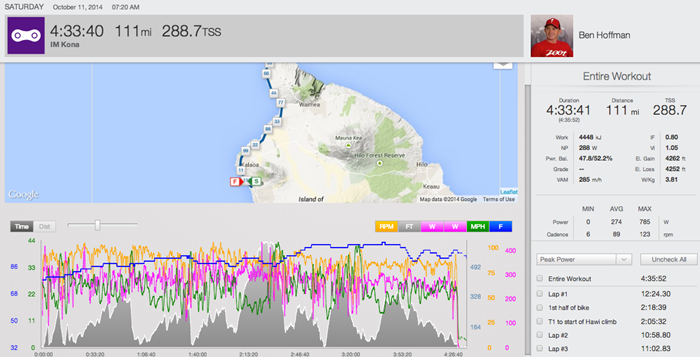
View Hoffman’s full Quarq Power File
- Over the full 112 miles, Hoffman averaged 274W, or 3.81 W/kg,
- During the 17 minute climb to Hawi, Hoffman put out 313 watts and only averaged 17.6 mph.
- Hoffman kept the power down on the descent from Hawi averaging 275 watts and 38.7 mph.
Maik Twelsiek’s Fastest Bike Split of the Day in 2015

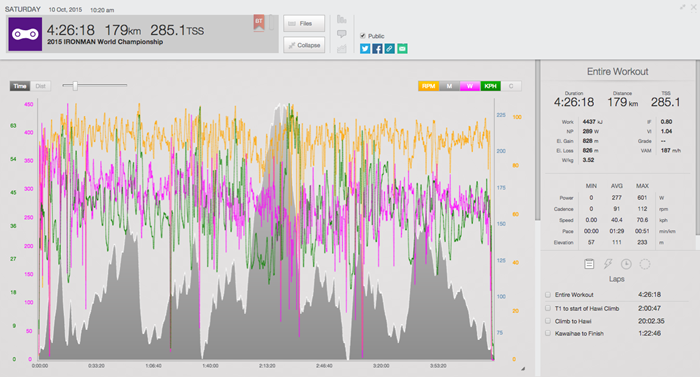
View Twelsiek’s full SRM power file.
- Twelsiek’s file has a textbook Intensity Factor of .80 and Variability Index of 1.04. These are the numbers we consistently see from successful pro male athletes.
- Twelsiek’s Peak 20 Minute Power of 315 watts, 4.01w/kg, comes in the first 20 minutes of racing.
- Out of transition to the start of the climb to Hawi, Twelsiek averaged 298 watts, or 3.79w/kg for 2 hours.
- From Kawaihae to the end of the bike, Twelsiek averaged 279 watts over 1:22, which is a very minimal drop in power from what we typically see.
Kyle Buckingham’s Age Group Overall Win in 2013

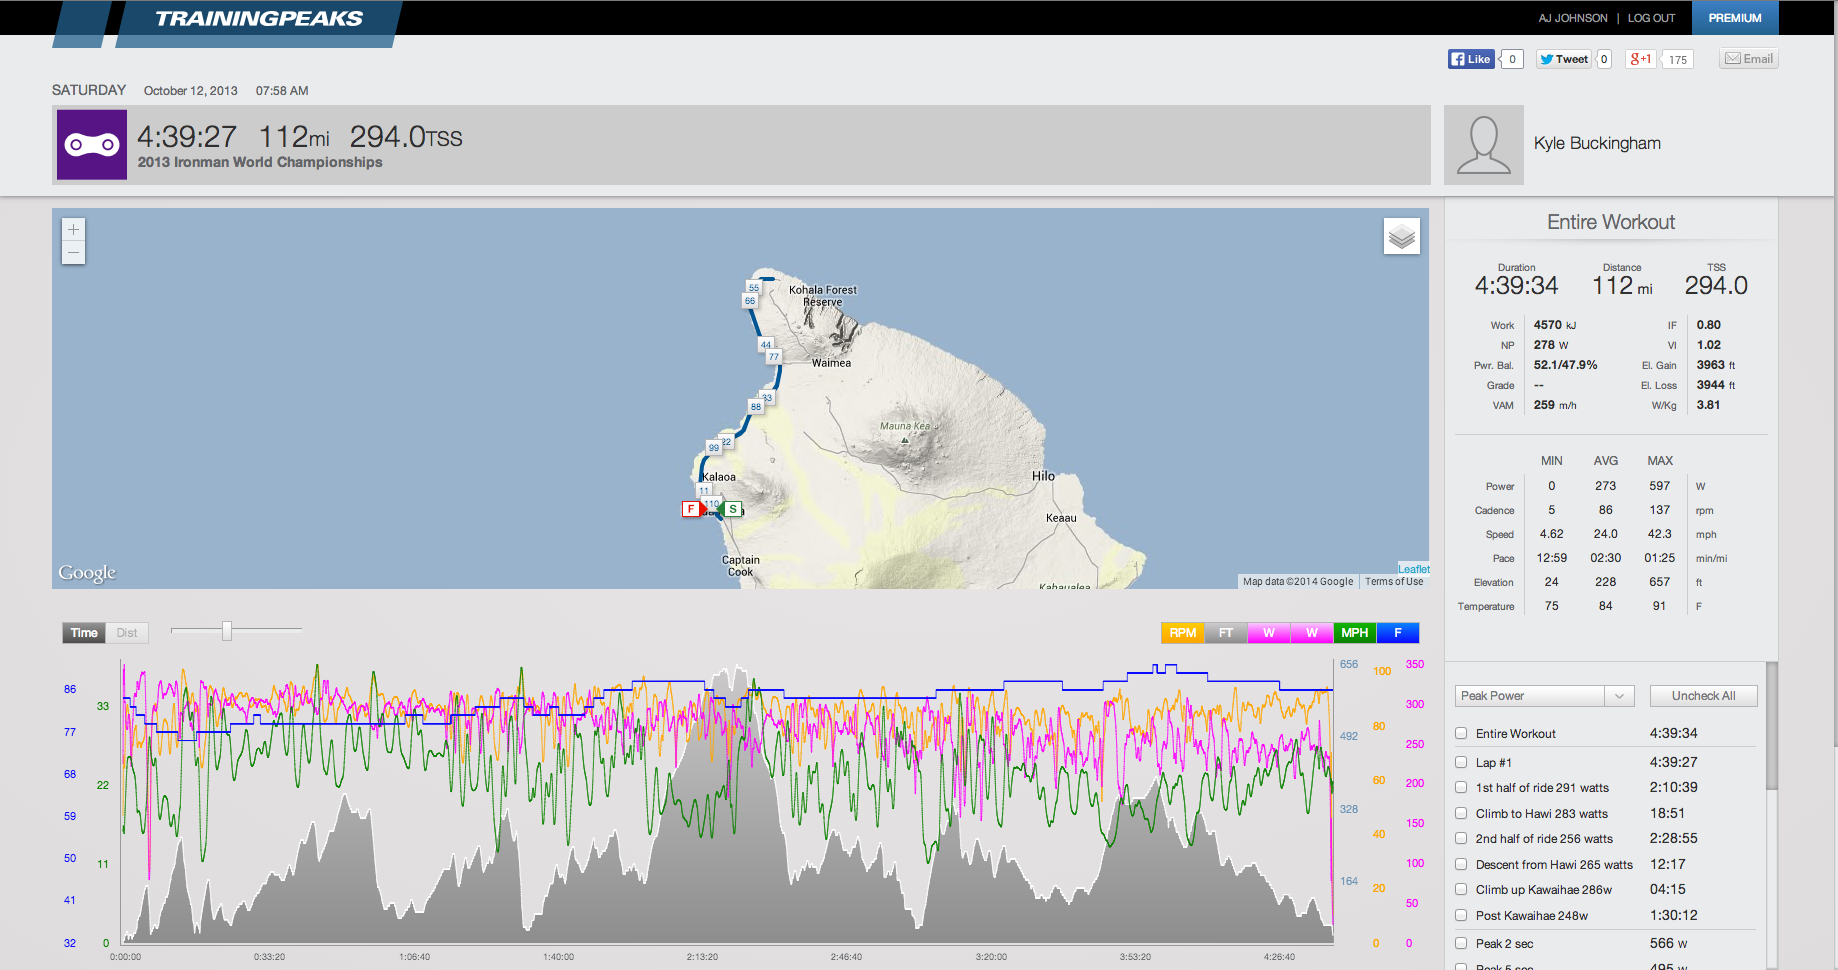
View Buckingham’s full file here.
- Climbing to Hawi, Buckingham upped his watts to 283, or 3.95 w/kg for the 18:51 effort.
- Not letting up on the descent from Hawi, Buckingham still cranked out 265 watts- another aspect of his file that is similar to the pros.
- The average age grouper should hold an Intensity Factor of .60 to .70, which equates to a 6 or 7 on the rate of perceived exertion (RPE) scale. Buckingham was able to push an IF of .80, the top end even for the pro men.


