
At the scientific heart of WKO5 lies the Power Duration Model. This highly accurate and individualized model supplies a series of tracking metrics that are focused on making it easy to deploy and manage endurance sports performance analytics. Below are a list of these metrics, which are also available in TrainingPeaks.
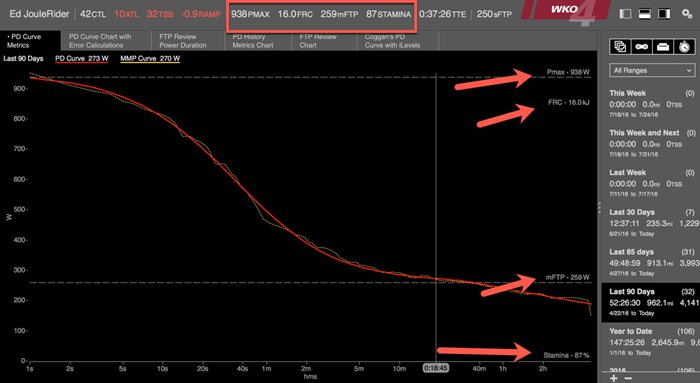
Pmax
The maximal power can be generated over at least a full pedal revolution of both legs. This metric gives clear insight into an athlete’s neuromuscular power.
Functional Reserve Capacity (FRC)
The total amount of work that can be done during continuous exercise above Functional Threshold Power. This metric gives insight in an athlete’s anaerobic work capacity.
Modeled Functional Threshold Power (mFTP)
The model-derived highest power a rider can maintain in a quasi-steady-state without fatiguing. This metric gives clear insight into an athlete’s threshold. This metric is not new, but having an objective, model-derived estimate allows for additional analytics.
Stamina
A measure of resistance to fatigue during prolonged-duration, moderate-intensity exercise. The Stamina metric gives excellent insight into an athlete’s ability to resist fatigue over longer-duration performance at sub-threshold effort.
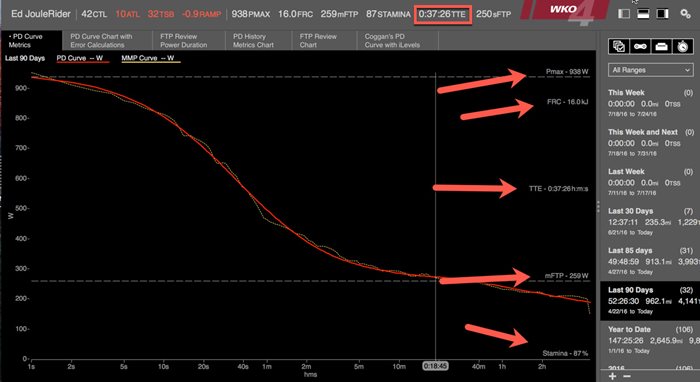
We are excited to introduce WKO5’s next step in analytical metrics: Time to Exhaustion (TTE).
Time to Exhaustion (TTE)
The maximum duration for which power equal to mFTP can be maintained. This metric gives insight into an athlete’s resistance to fatigue in threshold-level performance while providing additional insights to better demonstrate Functional Threshold Power.
Developed by Dr. Andrew Coggan, TTE has now been implemented in WKO5 and is an excellent addition to the already powerful combination of tracking and performance metrics, adding insight into and tracking of athletes’ ability to perform at threshold. Therefore, to understand TTE, we need to revisit Functional Threshold Power.
What is Functional Threshold Power?
The idea of Functional Threshold Power (FTP) has been around for over ten years now, and it’s still going strong. FTP is used as the basis of a lot of training systems and has become widely used to estimate threshold in numerous training approaches. Over the years, numerous authors, websites, and publications have attempted to redefine FTP, which has led to a confusing array of slightly different definitions. With the introduction of WKO5 and the Power Duration model, a new focus on FTP as a training and tracking metric has again put the definition in the spotlight.
Functional Threshold Power was developed by Dr. Andrew Coggan and is specifically defined as “the highest power a rider can maintain in a quasi-steady state without fatiguing.” It is an estimate of the power output that corresponds most closely with the maximal metabolic steady state or metabolic control limit, or what is more commonly referred to as “threshold.” In contrast to VO2max, which is primarily limited by the cardiovascular system’s ability to deliver O2-carrying blood to contracting muscle, this threshold is primarily determined by muscular metabolic fitness, i.e., the ability to balance aerobic ATP production via mitochondrial respiration with ATP utilization.
What Does Threshold Mean?
As alluded to above, exercise physiologists tend to often use the term threshold (or sometimes even lactate threshold) to generically refer an individual’s metabolic fitness. The term threshold is used because even though with increasing exercise intensity changes in substrate metabolism occur on a continuum, there comes a point (or exercise intensity) at which your body’s metabolic responses change significantly and measurably. This transition is typically tracked by measuring blood lactate levels during a test in which the exercise intensity is increased progressively, making it possible to prescribe training intensities based on specific lactate values.
Athletes generally believe that lactate is a waste product produced only during high intensity, anaerobic exercise, but in reality, aerobic and non-aerobic glycolysis can occur simultaneously, regardless of how hard you’re exercising. The contribution of each process will vary depending on the intensity of exercise. At low intensities, when the rate of glycolysis is low, all or essentially all of the pyruvate produced will be oxidized by the mitochondria, such that the production of lactate is minimal. As exercise intensity increases, however, the rate of glycolysis (and in particular, the rate of glycogenolysis) accelerates, causing more and more of the pyruvate to “spill over” to lactate. The accumulation of lactate in muscle, and hence in the blood, therefore provides a very convenient, albeit indirect, marker of muscle energetics and substrate metabolism, which are key determinants of exercise performance.
Measurement of blood lactate for the above purpose has therefore become quite commonplace, both in the scientific literature and among coaches and athletes. Unfortunately, many definitions exist as to precisely what constitutes lactate threshold. In general, these various definitions tend to yield results that cluster around two exercise intensities. First, the exercise intensity at which blood lactate levels first begin to increase during incremental exercise, or second, the exercise intensity at which blood lactate levels increase continuously during constant-intensity exercise. At intensities in between, blood lactate levels will rise initially, but will then decline back towards, and possibly all the way back to, resting levels. During prolonged exercise to fatigue, there can also be a secondary increase late in exercise, due to recruitment of type II, or fast-twitch fibers, still containing residual glycogen, and/or catecholamine-induced glycogenolysis in non-exercising muscle.
The first point actually corresponds to an exercise intensity that can be sustained for several hours, like the duration of marathon run for example. However, in reality, it is the second point that coaches and athletes perceive as “threshold”, and it is this disconnect between the scientific and applied realms that has contributed to so much of the confusion that exists about this topic.
This second, higher, exercise intensity can be estimated or determined in various ways, but the most direct, and hence most accurate, approach is to simply have an individual perform a series of longer (typically 30 minutes) efforts at constant intensity and measure blood lactate throughout exercise. The highest exercise intensity at which blood lactate levels are stable (or quasi-stable) represents the athlete’s maximal lactate steady state (MLSS). MLSS represents the highest exercise intensity at which the rate of lactate clearance matches the rate of lactate production, and corresponds to an exercise intensity that can typically be maintained for 30 to 60 minutes, though some scientists say 40 to 70 minutes.
Notably, this exercise intensity also tends to correspond to a number of other physiological transition points, the iEMG threshold, the NIRS breakpoint, the second ventilatory threshold or respiratory compensation point, etc. among them. In other words, MLSS is simply a surrogate marker for numerous physiological/metabolic events. Ideally, MLSS will occur at a relatively high workload, indicating a high level of muscular metabolic (as well as cardiovascular) fitness. Adaptations to training that result in an improved ability to produce ATP aerobically will be reflected by MLSS occurring at a higher workload.
Why Functional Threshold Power?
The metric was designed to utilize bicycle power meters to determine and track a power-based, highly accurate estimate of an athlete’s metabolic fitness through simplified testing or data tracking. Before power data, athletes who wanted to track such changes generally needed access to an appropriately equipped laboratory run by knowledgeable personnel. Not only is such testing invasive and often costly and difficult to obtain, it only provides an indirect estimate of an individual’s actual performance ability. Coggan’s introduction of a functional metric that utilized power data to provide such information directly allowed for easy measurement based on an athlete’s functional abilities as measured with a power meter.
Sustaining Functional Threshold Power
As noted, MLSS is an exercise intensity that can typically be sustained for 30 to 70 minutes. Since FTP is a simplified tracking metric of MLSS, it has the same sustainable time range (not specifically one hour, as often stated by others). Since this roughly corresponds to the duration required to complete a 40km time trial, the latter provides an excellent estimate of power at MLSS, especially when you consider how flat the power-duration relationship is in this region. In addition to improved metabolic fitness being reflected in a higher power at MLSS/FTP, however, training also tends to improve the duration that exercise at this intensity can be maintained.
To better understand this, we need to first understand the idea of sustained power output. Sustained power output reflects the length of time an athlete can put out a level of power without a noticeable degradation or decline in such power- statistically speaking, a point of deflection. Although again such changes actually happen gradually on a continuum and not really abruptly, such a point can typically be seen in in most athletes’ power duration and mean maximal power curves for hard, steady-state efforts lasting around an hour. It can therefore be modeled as a downward “kink” in the tail of the power duration curve.
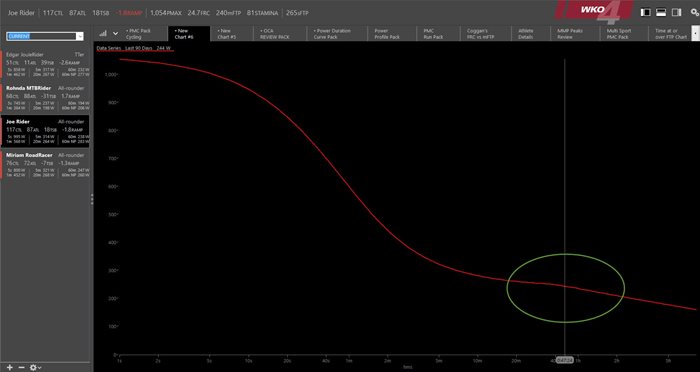
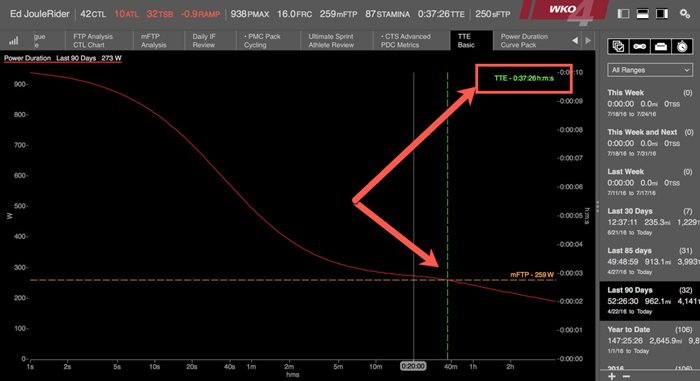
This kink or defection point is representative of the athlete’s Time to Exhaustion (TTE) and is a measurement of the maximum duration for which a power equal to FTP can be maintained. Although this range can be from 30 to 70 minutes, for many training athletes, it typically falls in the range of 40 to 55 minutes, which is one of the reasons why it is often associated with an hour, and why 40km (really ~40 km, since few courses are measured precisely) time trial power was originally proposed as the best estimate.
Introduction of Time to Exhaustion (TTE) Metric
In a recent update of WKO5, Dr. Andrew Coggan introduced the newest Power Duration metric, Time to Exhaustion (TTE). It is defined as:
The maximum duration for which a power equal to model-derived Functional Threshold Power can be maintained.
This new metric allows for the measurement and tracking of riders’ ability to maintain power over time, estimating the time they can hold power equal to their threshold. On the Power Duration Curve, TTE can is visually represented by a vertical line just after the kink or decline in sustained power outputs.
How You Can Use TTE
In endurance sports, the core of training is (but isn’t limited to) an effort to improve a blend of aerobic and anaerobic fitness. If we visualize this effort via the Power Duration Curve, the effort to increase FTP can be broken into two specific tracking metrics and goals:
- Increase FTP. Training to improve FTP is typically focused on lifting the Power Duration Curve by increasing the amount of power one can put out in this quasi-steady state.
- Extending TTE. Training to extend the maximum duration at which a power equal to FTP can be maintained.
With the introduction of Time to Exhaustion, tracking these two metrics simultaneously gives us deeper insight into athlete’s’ strengths and limiters, a better understanding of the response to exercise stimuli, and a better estimation of performance capabilities for both training and events.
The new training metrics in WKO5 give us a well-rounded physiological picture of the athlete and the response (or lack thereof) to training, while also giving us deeper insights into performance capability. Blending Pmax, Functional Reserve Capacity, Functional Threshold Power, Time to Exhaustion, and Stamina scores gives both coaches and athletes alike deeper insights into training and racing performance.
Contributions to this article made by Dr. Andrew Coggan