 “Experience is simply the name we give our mistakes.”
-Oscar Wilde
Tracking and analyzing your progress is a major component of success whether it comes to sport or life. By looking at where we have been we can get a clear picture of what we did well and what we could have done better – giving us the chance to change our strategy the next time we are faced with the same or similar circumstances. By adjusting our game plan thus, we can avoid making the same mistakes twice.
I strongly believe in this idea of objective analysis and calibration both as an athlete and a coach. Recently, I completed IRONMAN 70.3 Kansas for the second year in a row, and when I looked back at the data I saw a perfect illustration of how tracking and analyzing can be a powerful ally in your pursuit of perfection as an athlete.
Below are two power files from the Kansas 70.3 bike course, 2012 and 2013 respectively, and they tell two very different stories.
In 2012…
I had just started using my power meter and approached this course with the wrong game plan – paying for it dearly.
Being a good climber I decided that I would attack the many hills as I saw this as my advantage. My goal wattage was 212 watts Normalized Power (NP) or an Intensity Factor (IF) of .85. In laymen’s terms, what this means is that I aimed to average about 85% of my threshold power for the bike, my threshold being the maximum power I could sustain for a one-hour all-out effort. This IF is at the high end of the generally recommended range of .75 to .85 for age groupers racing the 70.3 distance.
(Note: At the time Garmin had yet to release the firmware update for the 910 with NP so I was left with average power as my guide). Take a look at the power file below.
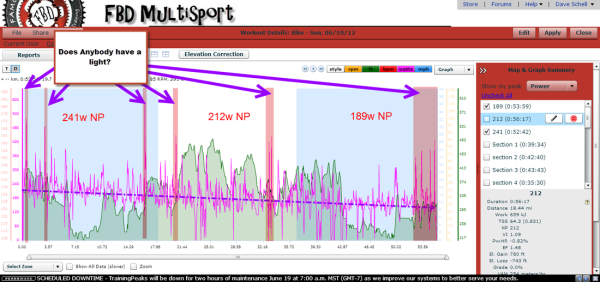
I started hammering right out of transition with the first climb as evidenced by the first burnt “match”. I was relentless and passing my competitors one after another. At about 15 miles in I put on a display of my climbing ability burning another precious match, going well above threshold holding 330 watts for 1 minute. It’s not long after this that you can hear the crack as my power starts a steady decline all the way to transition.
With my flawed plan of attacking the hills and hammering on the flats I totally overshot my goal of 212 NP by 29 watts – I put out 241w NP for an IF of .94! Furthermore, my variability index (VI), which measures how “smooth” your pacing is during a ride, was a whopping 1.11. A VI of 1.0 indicates perfectly smooth power output – my VI of 1.11 makes you think “road race” rather than “Ironman” – not steady pacing at all! As seen in the picture below, this was not sustainable. At about two hours into the bike I wanted to go home, and heading into T2 I was praying for something to happen so that I would not have to explain the dreaded DNF. Needless to say that after expending all of my energy on the bike I had a horrible run and a very long day.
In 2013…
Using what I had learned from analyzing my 2012 power file in TrainingPeaks I decided that this year I would be fairly conservative and hold back on the hills. During my training leading up to Kansas, I worked on 3-5 minute climbs in the small chainring at or below my threshold, and long tempo intervals at 80% of threshold. This simulated the demands of the race that I observed in my 2012 power file.

During the race, on every hill I shifted into the small chainring and tried to keep it below 280 watts (close to my threshold power) – this paid off in far fewer matches burned. Not only did I conserve energy but this gave me a chance to refuel as I watched my competitors hammer up and away from me (at least in the early part of the race). Also, rather than trying to maintain my wattage on the descents I used this as an opportunity to spin out my legs, recover, and prepare for the next hill. In the flats I was able to maintain a steady wattage and was easily hitting my goal of 220 NP and .80 IF while producing a much better paced race with a VI of 1.06. I knew things were looking up when at two hours into the bike I couldn’t wait to start running. I maintained this steady wattage all the way into T2 and was rewarded with the best run I have had at the 70.3 distance. By playing conservatively and not burning matches frivolously I was able to maintain my goal wattage from start to finish and still have enough in the tank for a great run.
The Moral of the Story
Training with power and/or heart rate and a GPS device is a great start, but if you are not analyzing your data afterwards then you are just making pretty graphs in vain. There is incredibly valuable information that can be gathered from your race data – you just need the right tools and knowledge to pull it out. By taking the data from my 2012 race at Kansas 70.3 and analyzing it, I was able to learn from my mistakes and come up with a better game plan for 2013. This knowledge presented itself in my training, my race strategy, and in realizing that you cannot win the race on the bike – but you can definitely lose it.

