
Speed.
No matter the sport, no matter the age or competitive level, speed is the great equalizer. All-things-being-equal, more sports place a bounty on speed than any other athletic characteristic. Elite distance runners have long-known that speed-endurance (which is truly what the distance events have become in elite sport) is built upon available speed (e.g., speed is the first limiting factor to speed-endurance).
What we know about speed and how to train for it, harness it, and repeat it consistently (speed-endurance) is ever-evolving in the sports performance and applied sport science field. Equally evolving are the ways and means with which we measure and monitor speed in our athletes. What we do know about working in elite distance running is that optimizing speed has become key to improved performance through the trappings.
Using power meter technology from RPM² is one way our coaches are leveraging data to ensure optimum realization of potential in our athletes, regardless of sport, age, gender, ability level, or disability. Data is fast-becoming the second “voice” of the athlete, and to hear it, understand it, and use it to better the performance outcomes is our charge as performance coaches.
With power becoming a generally accepted, yet somewhat new key metric of importance when assessing running performance it has become more and more evident to many coaches and athletes that deeper analysis of power data can yield tremendous insights into training, recovery and athlete monitoring. The following case study will illustrate one such deeper metric of power analysis during running that has implications for improving performance in ways perhaps not fully understood or accepted by the mainstream as yet: bilateral symmetry.
Although no athlete is truly “symmetrical,” we do see in the linear speed and speed-endurance athlete asymmetries in power, strength, mobility and running mechanics as areas of opportunity for improved efficiency and decreased injury potential. We have also seen athletes improve absolute speed by diligent programming targeted at specific right/left imbalances.
For the purposes of this article we will use RPM² data taken from two separate trials of repeat 100 yard sprints performed at a predetermined timed pace (termed “trial 1” and “trial 2,” respectively for this discussion). These two “trials” will be used to illustrate the importance of monitoring for bilateral symmetry changes with training.
Figure 1. Power and cadence dashboard for trial 1.
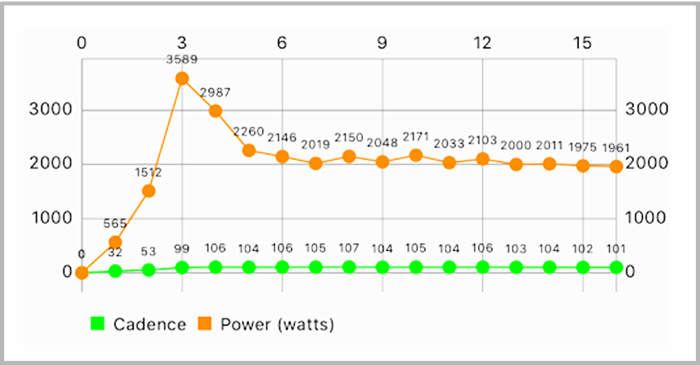
Figure 2. Power and cadence dashboard for trial 2.

Figure 3. Bilateral symmetry comparisons between trial 1 and trial 2.
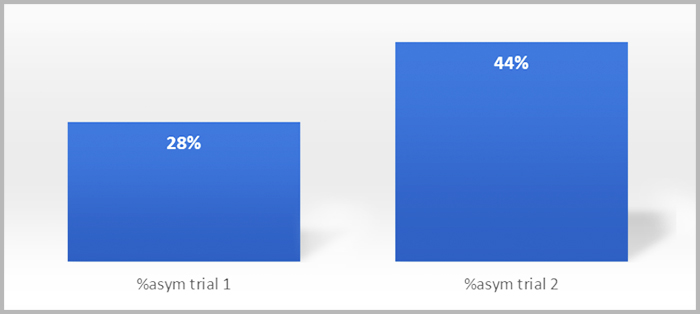
Figure 3 shows the total asymmetrical power outputs for each trial. As can be seen in Figure 3, total power of the two trials is significantly different, with trial 2 requiring 16 percent more power to complete the task of the 100 yard sprint in relatively the same total time. Taken alone this information is very valuable, as we would expect to see a well-conditioned athlete able to complete repeat trials such as this with limited variability in total power outputs for the same “speed” required to complete the task in the given time constraint. Taking this data into account allows the athlete and coach to begin to monitor changes in power over time for a given distance and time requirement to ascertain how the athlete is responding to the training stimulus. In this case, if the requirement was to complete the distance in a given timeframe with incomplete recovery (i.e., a “speed-endurance” training stimulus) a favorable result would be data indicating the athlete’s ability to maintain consistent power outputs (or potentially decrease power required for each successive rep) over the course of the training session. If this session was aimed at improving speed, then we would expect this athlete to cover the given distance in trial 2 in less time than trial 1, given that the total power output was greater for that trial. Taken by itself, this data is very valuable in tracking just how effectual the training stimulus is (e.g., is the athlete improving with the training plan?).
Looking closer at the data from these trials offers us a deeper understanding of what exactly is going on kinetically. A sample dashboard (Figure 4) from trial 2 shows what sort of data can be gleaned from using this technology, and seen here is some obvious drivers of the asymmetries noted in power from trial 1 to trial 2.
Figure 4. A sample dashboard view of trial 2, showing the asymmetries in ground contact time and flight time between right and left limbs.

When looking deeper at total power data for each limb using RPM² it is noted that this athlete demonstrates a significant right/left asymmetry in power for both trials. Even more compelling is how this power asymmetry increases substantially (more pronounced/more asymmetrical) during trial 2.
Figure 5. Asymmetries between trial 1 and trial 2.

Continued depth of analysis using this tool reveals that although cadence for the two runs remains stable, asymmetrical findings from trial 1 in ground contact time and flight time are exacerbated during trial 2. Taken alongside the power data findings it would appear that potentially the “intensity” of trial 2 (in this case intensity would come from the speed-endurance progressive overload due to incomplete rep recovery time) has magnified the right/left asymmetries of this athlete.
This data alerts the coach and athlete to pay closer attention to the actual kinematics and kinetics of the individual repetitions, instead of only focusing on the total time per repetition. If not for this tool, the coach/athlete might consider the rep of trial 2 “successful” because he/she “made the time” required for the 100 yard interval. However, as can be seen with this deeper look at the data available through this technology, the asymmetries in power and stride characteristics can be a powerful tool used to identify how the athlete is tolerating the overloads of training, how well the athlete is adapting to the training progression, and if/when adjustments to the training plan should be made to ensure that hidden asymmetrical compensations in power production, ground contact time and flight time are not being relied upon to adapt to the training stimulus.
In this particular case-study, it would be important for the coach/athlete to closely track and monitor data using this technology across the next speed-endurance session, along with some other subjective and objective tools that are easy to access, to identify potential areas of opportunity for improved running mechanics during periods of fatigue, potentially look for areas of imbalances in the athlete’s power production profile (stiffness, single-limb reactive power), or possibly identify areas of asymmetrical mobility and stability that could contribute to the magnification of kinetic asymmetry under times of metabolic intensity “stress” seen in this example. Simple running mechanics assessment can be done using very simple app-based biomechanical analysis tools like Dartfish Express (examples of this application in-use seen in the following video of a coach working with an athlete on 100 yard buildups to maximum speed. More advanced measures of single-limb strength, dynamic stability, reactive stiffness and joint-system balance of mobility-stability would all be additional levels to assess on athletes demonstrating significant asymmetries in power.
To learn more about RPM2 products, click here: www.rpm2.com/trainingpeaks
