
View the power data from some of the top athletes at Kona 2016.
Lionel Sanders

View Sanders’ full PowerTap power file.
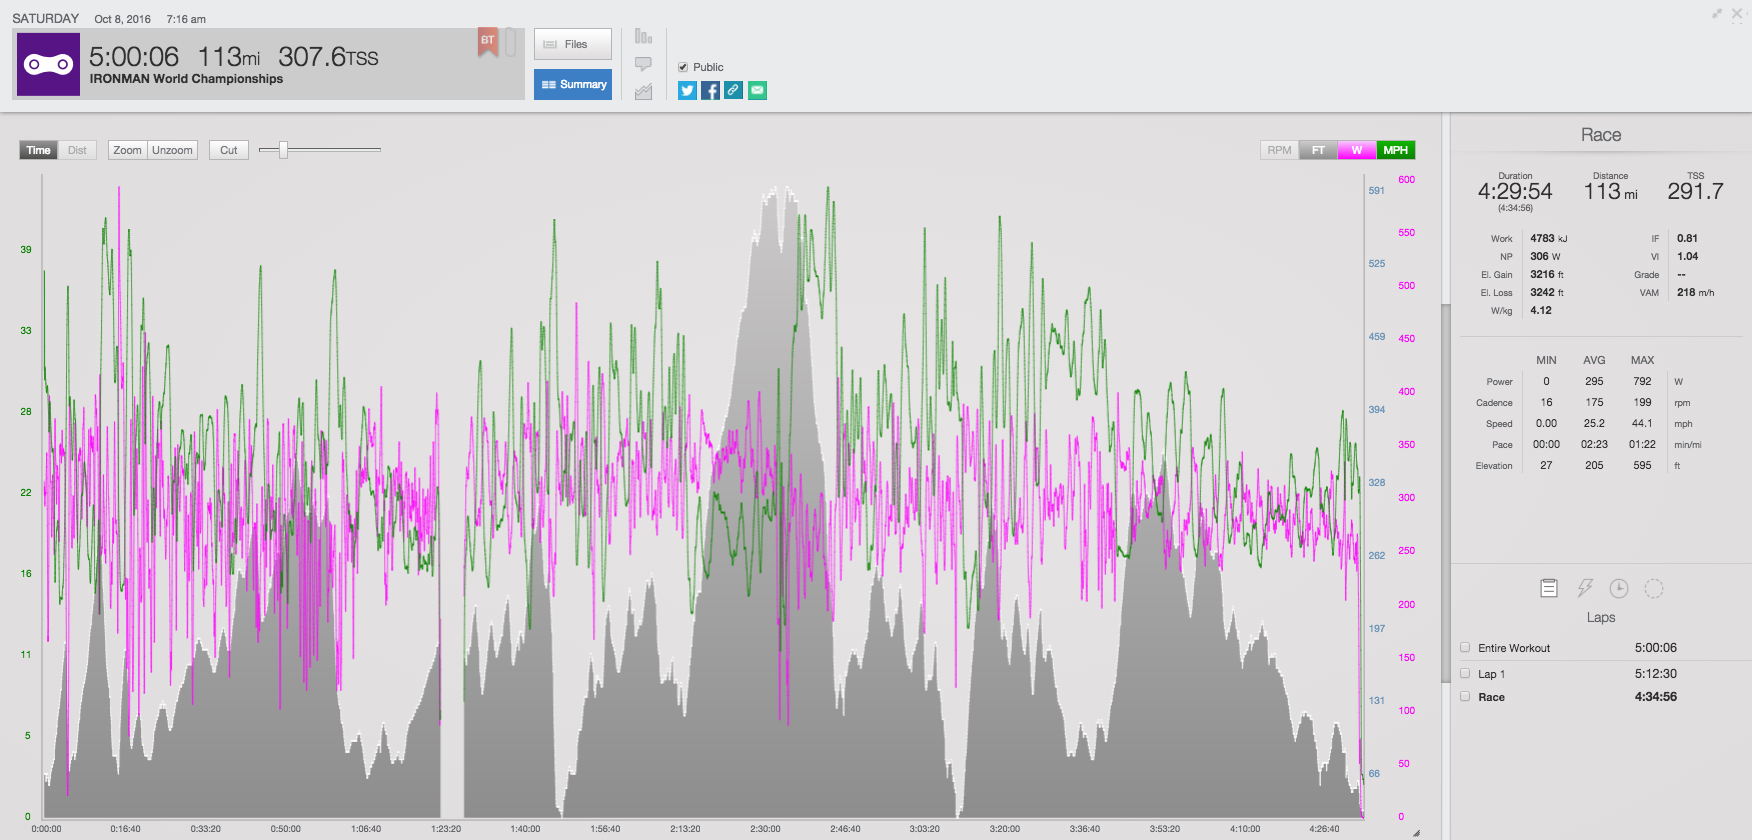
- Sanders’ Normalized Power for the full 112 miles was an amazing 306 watts and he averaged 40.6kph, or 25.1mph.
- While that is a very big number, it is only 77 percent of his Functional Threshold Power, as shown by his .77 Intensity Factor.
- His Variability Index was 1.02, showing that his power output was very smooth, though his dip in power from the first half to the second means that he could have paced it better.
Frederik Van Lierde
View Van Lierde’s full ROTOR power file.
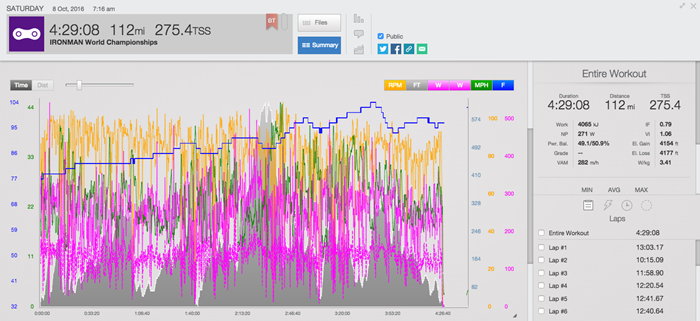
- Van Lierde paced his effort very well. He was able to average 5 more watts in the final hour on the bike than the first.
- He received a penalty early on, and once back on the bike he averaged 315 watts. This was still 5 watts less than his Peak 20 of 341 watts, or 4.76W/kg, set while climbing to Hawi.
- He averaged 295 watts, or 4.12W/kg and 25.2mph.
Michael Weiss
View Weiss’ full SRM power file.
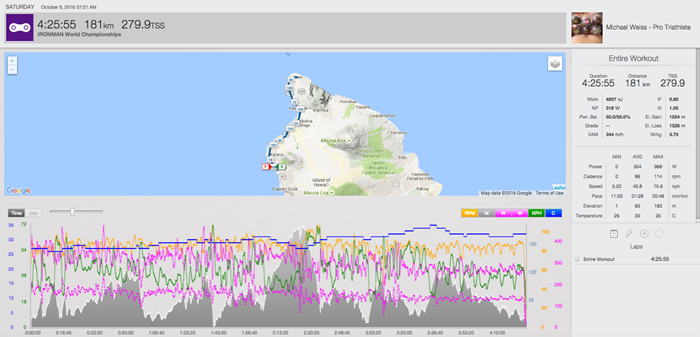
- For the first two hours, Weiss averaged 328 watts, or 4.05W/kg. at 41.1kph, or 25.4 mph
- Weiss’ Intensity Factor was .80, or 80 percent of his Functional Threshold Power.
- His Variability Index was 1.05, right at the limit of what we see for a successful power file.
Ben Hoffman
View Hoffman’s full Quarq power file.
- Hoffman averaged 253 watts, or 3.38W/kg for the full ride.
- On the climb to Hawi, his power jumped to 311 watts, or 4.16W/kg at 19.4mph.
- Hoffman averaged 25.1mph and burned 4064 calories.
Jesse Thomas

View Thomas’ full PowerTap power file.
- In the first two hours, Thomas’ Normalized Power was 297 watts.
- Up to Hawi, Thomas upped his Normalized Power to 313 watts at 18.9mph.
- Over the full bike, Thomas averaged 257 watts, or 3.36W/kg.
Sarah Piampiano

View Piampiano’s full PowerTap power file.
- Over the full 112 miles, Piampiano put out a Normalized Power of 212 watts.
- Cimbing to Hawi, her average power was 218 watts at 84rpm.
- Her Variability Index was 1.02 showing that her effort was very smooth throughout the day.
More power analysis coming soon.
Read more about how the pros prepare for Kona, get predictions for the race, and check out live interviews from the Big Island.
