Pete Jacobs – 1st Place – 8:18:37
281 Avg. Watts / 645 Max Watts / 4938 Kilojoules / 91 Avg. Cadence

- Pete came out of the water with the front group that included Frederick VanLierde and Luke McKenzie.
- Luke took the lead and brought the group up to leader Andy Potts. Pete stayed in 3rd place through the first 45 miles then made his move to the front. During this move he maxed out at 578W – enough to power a freezer.
- From T1 to the turn around he stayed in the top 5 and maintained 298W, or 4.3 w/kg (83% of his FTP) for over 2 hours. Amazingly, he was able to maintain a relative high average of 265W 93.8 w/kg) on the ride back to T2 and was 2nd off the bike.
- Coming down Hawi, riding a 54 tooth front chainring forced Pete to “spin out” at 120 rpm. He lost some position to riders with 55 tooth chainrings but put in a 300W effort for 10 minutes to stay at the front.
- With the fastest marathon times in the previous two years, Pete put himself in a great position starting the run.
- Ironman athletes can expend 8,000 to 10,000 calories during the race, roughly 1,000 cal/hr. At the high end of what the human body can absorb, they may consume about 400 cal/hr on the bike. Pete burned approximately 4900 calories on the bike. Add in about 1000 calories for the swim with no calories taken in, we estimate that he was at a 4100 calorie deficit heading out on the run.
Luke McKenzie – 24th Place – 8:54:58
256 Avg. Watts / 24.2 Avg. Speed / 4409 Calories / 74 Avg. Cadence
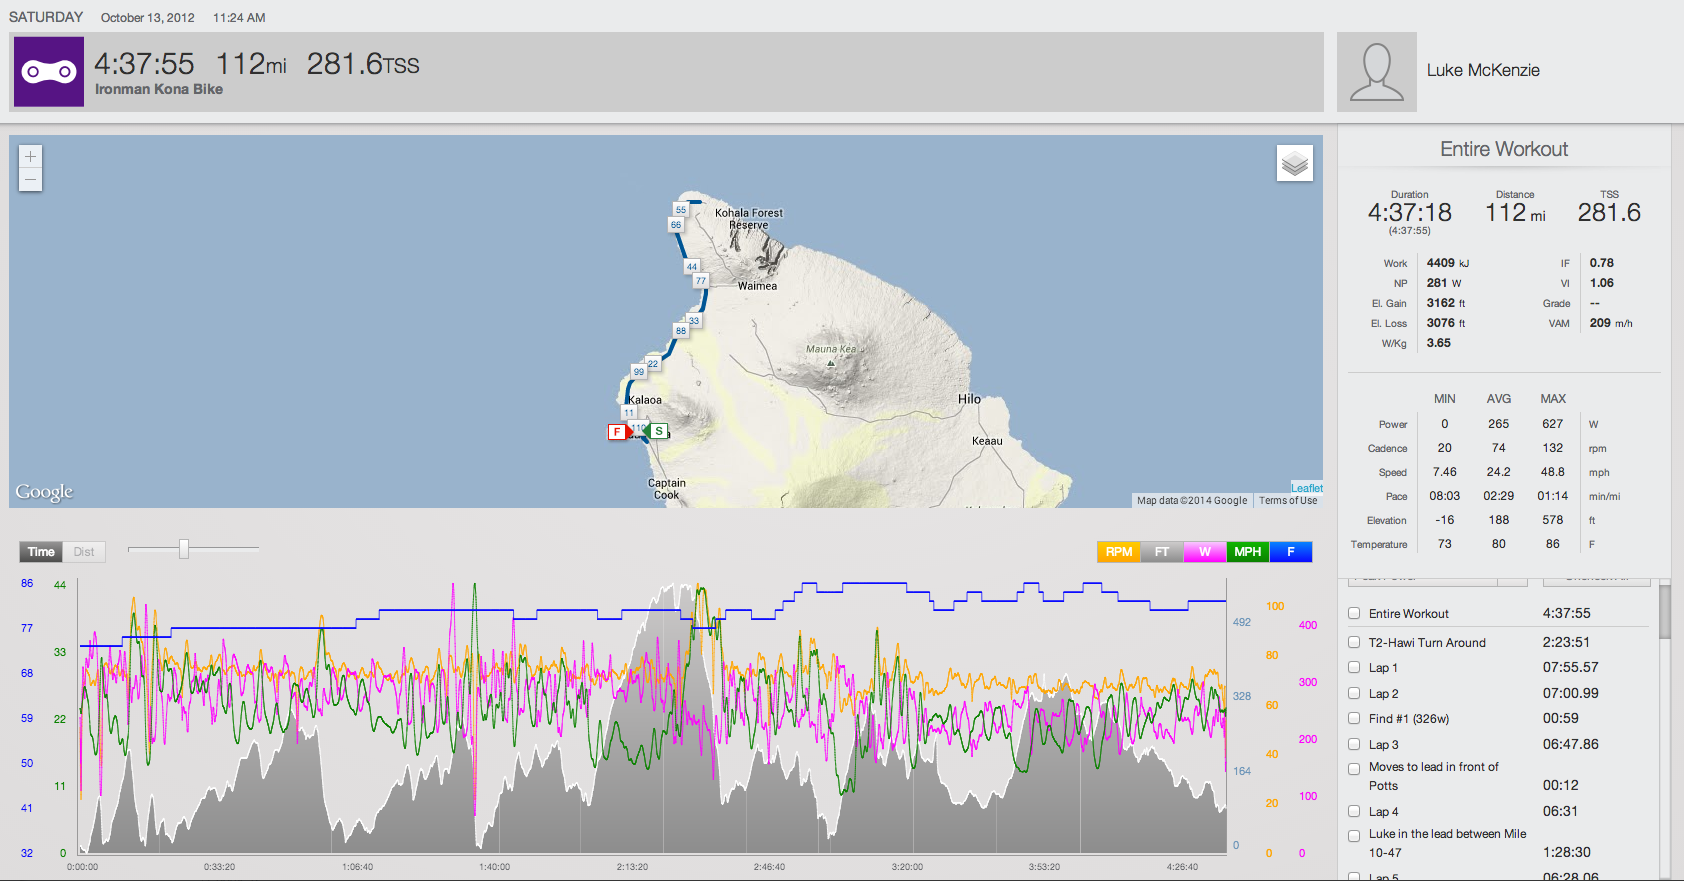
- Luke was 3rd out of the water, 56 seconds behind Andy Potts and with a group that included Pete Jacobs and Frederick VanLierde.
- With a group of top contenders a few minutes back, he led the charge to pass Potts for the lead after mile 10 and held it through mile 47. He averaged 290W (4 w/kg) and 25.5 mph during the first 44 miles of the bike. He maxed out at 627W. This is what it takes to lead the bike in Kona.
- This aggressive start may have caught up with him. The strong effort of 290W (80% of his FTP) from T1 to the turn around at Hawi kept Luke in the top 3. But, on the return trip he dropped to 238W average for the remaining 53 miles. He was 8th off the bike.
- Impressive effort by Luke in the 93 degree heat. An athlete loses 2 to 3% of their body weight during an Ironma. For Luke, at 160 lbs. that equals 5 to 8 lbs.
Rachel Joyce – 11th Place – 9:40:16
3.1 w/kg Avg / 408 Max Watts / 3466 Calories / 78 Avg. Cadence
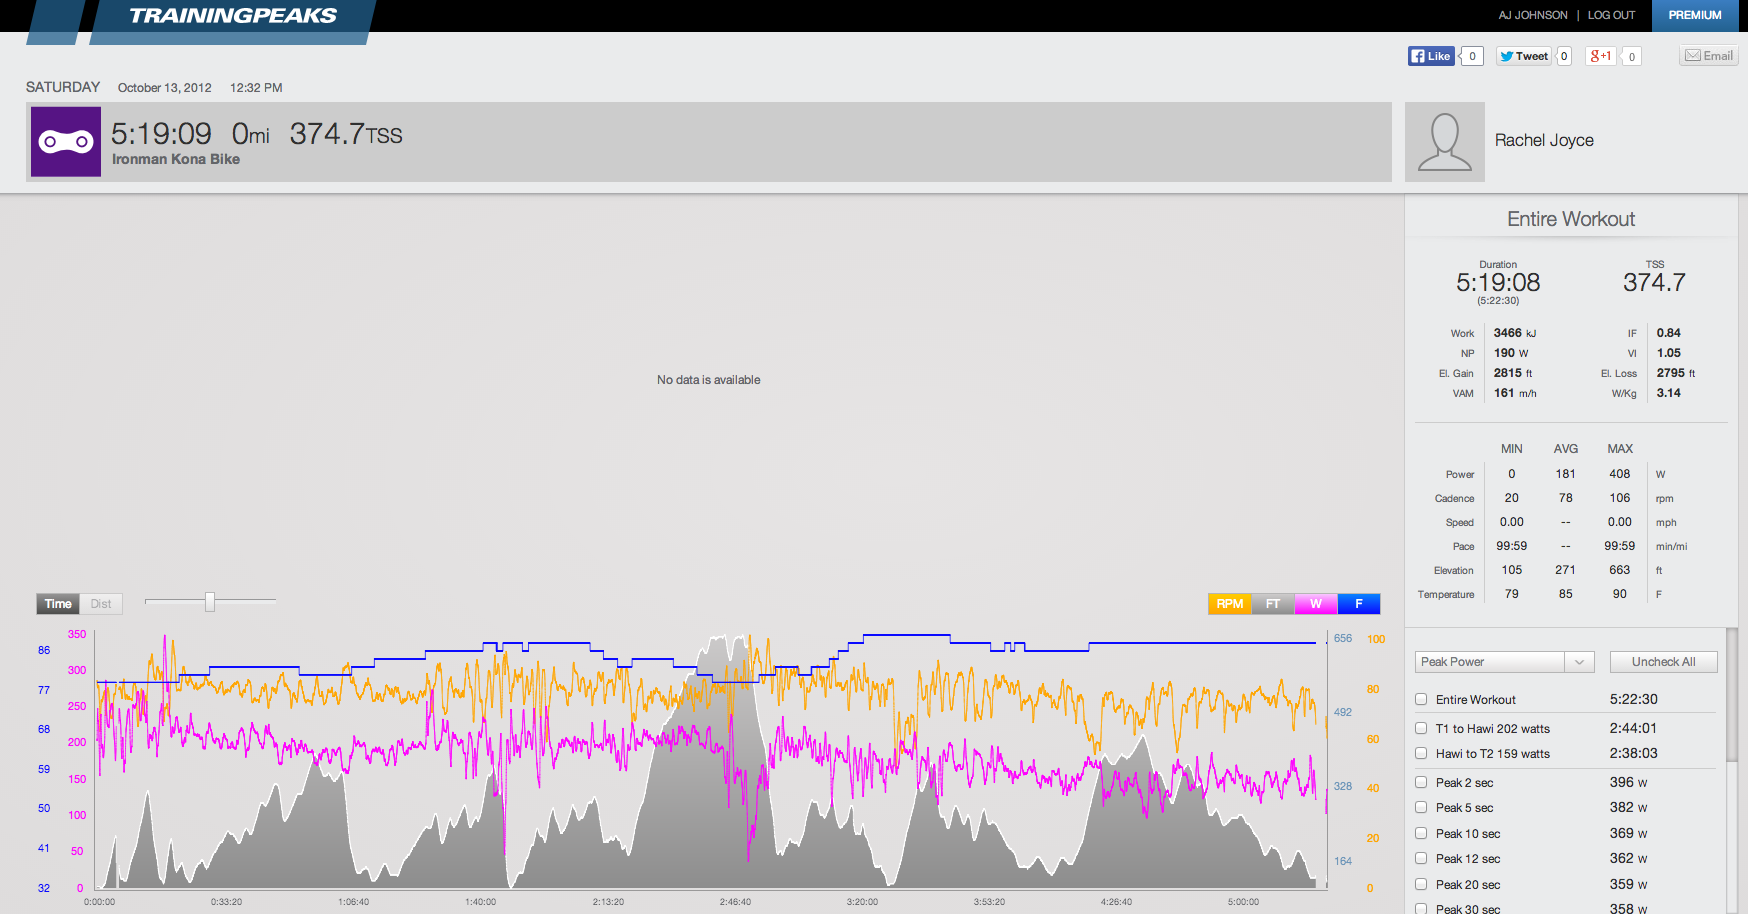
- Reporting an illness a few days prior to the race, Rachel still had a good swim and came out of T1 in the top 10.
- Despite making her day’s best effort at 212W (3.7w/kg) for the first 60 minutes, she remained around 8th place for the entire bike.
- From T1 to Hawi Rachel averaged 202W (3.5w/kg) for 2:44 and was in 6th place. She started losing ground around mile 60.
- From Hawi to T2 her avearge watts dropped to 159W (2.8w/kg) for the remaining 2:38 of the ride. She entered T2 in 15th.
- Rachel appears to like pushing a larger gear at a lower cadence than what is typical, averaging 78rpms for the bike. This is more of an issue of personal preference than performance, as a couple of athletes within the top 3 have also been known to pedal at lower than the “typical” rance of 85-95rpm. Another possibility is that athletes are able to use less “heart” at a lower cadence so with her upper respritory illness she may have been pushing a bigger gear to lessen the strain on her breathing.
- To stay in the top 10 for the bike, Rachel spent 45 minutes of her ride “red lined”. That is, 20% or more higher than her average power output for the day of 181W. This occurred early on as she fough for a good position. Keep in mind the fact that she’s recovering from an illeness- that amount of time in the “red” is the effort of a determined competitor.
